Figures & data
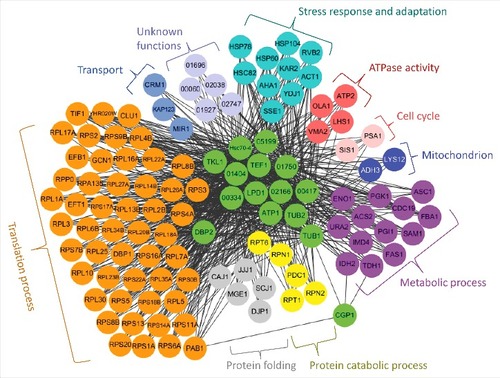
Figure 1. Structural and phylogenetic analyses of fungal CAP-Gly proteins. (A) Domain analysis was performed using the National Center for Biotechnology Information (NCBI) domain database (http://www.ncbi.nlm.nih.gov/Structure/cdd/wrpsb.cgi) and Pfam (http://pfam.xfam.org/). The domain abbreviations indicate the following: CAP-Gly (smart01052), Cytoskeleton-associated-protein-glycine-rich; SPEC (cd00176), Spectrin repeats, found in several proteins involved in cytoskeletal structure; Spc7 (smart00787), Spc7 kinetochore protein; Ubiquitin-like (pfam14560), Ubiquitin-like domain; Dynactin (pfam12455), Dynein associated protein; SPX (cl21499), Domain found in Syg1, Pho81, XPR1, and related proteins; BTB (smart00225), Broad-Complex, Tramtrack and Bric a brac; LRR (pfam13855), Leucine rich repeat; SH3_and_anchor (TIGR04211), SH3 domain protein; OmpH (smart00935), outer membrane protein (OmpH-like); Cyclophilin (cd00317), Cyclophilin-like peptidyl-prolyl cis-trans isomerase family protein; Atrophin (pfam03154), atrophin-1 family; CLIP1_ZNF (pfam16641), CLIP1 zinc knuckle. (A) CAP-Gly proteins in C. neoformans and their domain structure. (B) Phylogenetic analysis of Cgp1 orthologs in diverse fungal species.
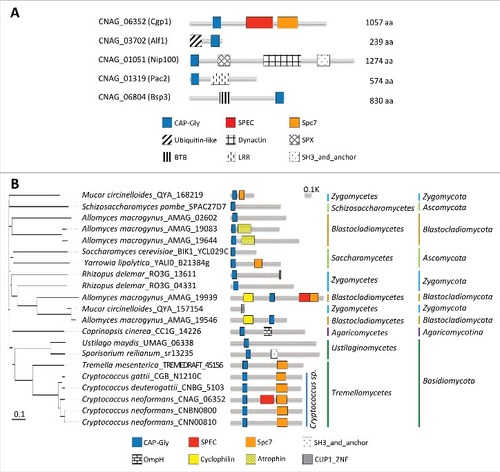
Figure 2. Cgp1 is involved in microtubule maintenance and is co-localized with tubulins. (A) Sensitivity test for cgp1Δ mutants to the microtubule destabilizer thiabendazole (TBZ) and benomyl. The WT (H99), cgp1Δ mutants (YSB1631 and YSB1632), and the cgp1Δ::CGP1 complemented strain (+CGP1, YSB3332) were grown in 2 mL of liquid YPD medium, serially diluted 10-fold, and then spotted onto YPD agar medium containing the indicated concentration (7 µg/mL) of TBZ or (4 µg/mL) of benomyl, further incubated at 30°C and photographed daily for 2–4 days. (B) Expression of CGP1 in response to TBZ assessed by qRT-PCR. The C. neoformans wild type strain (H99) was grown to the mid-logarithmic phase and then 7 µg/mL TBZ was added to the medium and incubation continued for 90 min, after which a portion of the cells was removed for total RNA isolation and qRT-PCR analysis. Three-independent experiments were performed. Actin was used to normalize the expression of CGP1. The cgp1Δ mutant (YSB1631) was used to confirm primer specificity for the CGP1 gene. The error bar indicates SEM. The P value was calculated by Student's t-test after normalizing the data to the basal expression level. (C) Co-localization of Cgp1 and microtubules/tubulin in the cytoplasm. The cgp1Δ::CGP1-mCherry-tagged strain grown to the mid-logarithmic phase was treated with TBZ (7 μg/mL) for 90 min or not-treated (0 min). Tubulins were stained with 0.5 μL of Tubulin Tracker Green. Cells were observed under a fluorescence microscope. The scale bars represent 10 μm. (D) GFP- tubulin strain (LK126) and cgp1Δ GFP-tubulin strain (YSB5536) were visualized by fluorescence microscope with Hoechst staining. Samples with or without the drugs (7 μg/mL TBZ or 4 μg/mL benomyl, treatment for 30 minutes) were observed by formalin fixation. White arrows indicate multinucleate cells.
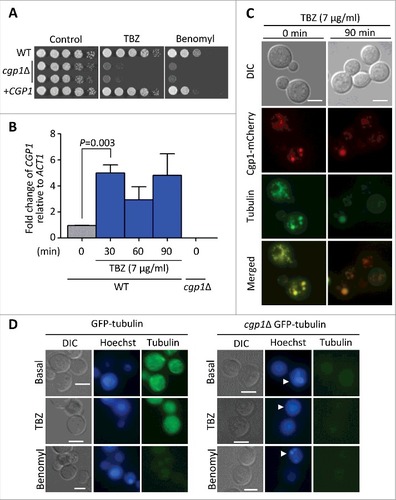
Table 1. Percentage of cells showing each number of nuclei.
Figure 3. Cgp1 contributes to genotoxic stress response and adaptation. (A) Each strain [WT (H99), cgp1Δ mutants (YSB1631 and YSB1632), and the cgp1Δ::CGP1 complemented strain (+CGP1, YSB3332)] was grown overnight in liquid YPD medium. Next, cells were serially diluted 10-fold, and spotted onto YPD agar medium containing the indicated concentration of flucytosine (5-FC, 500 μg/mL), hydroxyurea (HU, 100 mM), methyl methanesulfonate (MMS, 0.04%), phleomycin (0.3 μg/mL), or bleomycin (0.2 μg/mL). Cells were further incubated at 30°C and photographed daily for 2–4 days. (B) Quantitative RT-PCR examining the expression of CGP1 in response to 5-FC treatment. C. neoformans wild type strains (H99) grown to the mid-logarithmic phase were treated with 25 µg/mL 5-FC, incubated for 90 min, and a portion of the cells was removed for total RNA isolation and qRT-PCR analysis. Three-independent experiments were performed. The cgp1Δ mutant strain (YSB1631) was used as a negative control strain. Actin was used to normalize the expression of CGP1. The error bar indicates SEM. The P value was calculated by Student's t-test after normalizing the data to the basal expression level. (C and D) Strains grown as described in (A) were serially diluted 10-fold, spotted (3 μL) onto YPD agar medium, exposed to the indicated dose of γ-irradiation or UV light, further cultured at 30°C, and photographed daily for 1–3 days. (E) DNA fragmentation in response to HU was labelled by TUNEL assay. Each strain [WT (H99), cgp1Δ mutant (YSB1632), and cgp1Δ::CGP1 complemented strain (+CGP1, YSB3332)] was grown to mid-logarithmic phase at 30°C in liquid YPD medium and treated with (+) or without (–) 100 mM hydroxyurea for 3 h. Cells of each strains were labeled with Hoechst (blue fluorescence) and TUNEL (green fluorescence), and analyzed by fluorescence microscopy. Merged picture (Hoechst and TUNEL) analyzed using NIS-Elements software ver. 4 (Nikon). Bars, 10 µm. The mean GFP intensity of each strain was measured by fluorescence plate reader (Victor X5) from three biological replicates. Asterisk indicate the statistical significance of differences in GFP intensity between the basal and hydroxyurea treated, calculated by Student's t-test. Error bars represent SEM. #, P < 0.05; NS, not significant (P > 0.05).
![Figure 3. Cgp1 contributes to genotoxic stress response and adaptation. (A) Each strain [WT (H99), cgp1Δ mutants (YSB1631 and YSB1632), and the cgp1Δ::CGP1 complemented strain (+CGP1, YSB3332)] was grown overnight in liquid YPD medium. Next, cells were serially diluted 10-fold, and spotted onto YPD agar medium containing the indicated concentration of flucytosine (5-FC, 500 μg/mL), hydroxyurea (HU, 100 mM), methyl methanesulfonate (MMS, 0.04%), phleomycin (0.3 μg/mL), or bleomycin (0.2 μg/mL). Cells were further incubated at 30°C and photographed daily for 2–4 days. (B) Quantitative RT-PCR examining the expression of CGP1 in response to 5-FC treatment. C. neoformans wild type strains (H99) grown to the mid-logarithmic phase were treated with 25 µg/mL 5-FC, incubated for 90 min, and a portion of the cells was removed for total RNA isolation and qRT-PCR analysis. Three-independent experiments were performed. The cgp1Δ mutant strain (YSB1631) was used as a negative control strain. Actin was used to normalize the expression of CGP1. The error bar indicates SEM. The P value was calculated by Student's t-test after normalizing the data to the basal expression level. (C and D) Strains grown as described in (A) were serially diluted 10-fold, spotted (3 μL) onto YPD agar medium, exposed to the indicated dose of γ-irradiation or UV light, further cultured at 30°C, and photographed daily for 1–3 days. (E) DNA fragmentation in response to HU was labelled by TUNEL assay. Each strain [WT (H99), cgp1Δ mutant (YSB1632), and cgp1Δ::CGP1 complemented strain (+CGP1, YSB3332)] was grown to mid-logarithmic phase at 30°C in liquid YPD medium and treated with (+) or without (–) 100 mM hydroxyurea for 3 h. Cells of each strains were labeled with Hoechst (blue fluorescence) and TUNEL (green fluorescence), and analyzed by fluorescence microscopy. Merged picture (Hoechst and TUNEL) analyzed using NIS-Elements software ver. 4 (Nikon). Bars, 10 µm. The mean GFP intensity of each strain was measured by fluorescence plate reader (Victor X5) from three biological replicates. Asterisk indicate the statistical significance of differences in GFP intensity between the basal and hydroxyurea treated, calculated by Student's t-test. Error bars represent SEM. #, P < 0.05; NS, not significant (P > 0.05).](/cms/asset/221c2087-0790-45d1-9153-3a1127bc540b/kvir_a_1423189_f0003_oc.jpg)
Figure 4. Cgp1 promotes cell membrane integrity. Each C. neoformans strain [WT (H99), cgp1Δ mutants (YSB1631 and YSB1632), and the cgp1Δ::CGP1 complemented strain (+CGP1, YSB3332)] was grown overnight in liquid YPD medium at 30oC. Strains were serially diluted 10-fold, and spotted (3 μL) onto YPD agar containing the indicated concentrations of (A) SDS (0.03%) or amphotericin B (AMB, 1 µg/mL), (B) YPD (glucose-rich) or YP (glucose-starved) agar containing the indicated concentration of NaCl and sorbitol or (C and D) YPD at various temperatures. Cells were further incubated at 30°C for 2–4 days and photographed daily.
![Figure 4. Cgp1 promotes cell membrane integrity. Each C. neoformans strain [WT (H99), cgp1Δ mutants (YSB1631 and YSB1632), and the cgp1Δ::CGP1 complemented strain (+CGP1, YSB3332)] was grown overnight in liquid YPD medium at 30oC. Strains were serially diluted 10-fold, and spotted (3 μL) onto YPD agar containing the indicated concentrations of (A) SDS (0.03%) or amphotericin B (AMB, 1 µg/mL), (B) YPD (glucose-rich) or YP (glucose-starved) agar containing the indicated concentration of NaCl and sorbitol or (C and D) YPD at various temperatures. Cells were further incubated at 30°C for 2–4 days and photographed daily.](/cms/asset/2d4ccb5e-82e4-4799-a6aa-31c9ebb3b8b5/kvir_a_1423189_f0004_b.gif)
Figure 5. Cgp1 is required for C. neoformans virulence (A) For qualitative measurement of capsule production, each C. neoformans strain [WT (H99), cgp1Δ mutants (YSB1631 and YSB1632), and the cgp1Δ::CGP1 complemented strain (+CGP1, YSB3332)] was grown overnight and then spotted onto solid DME agar medium and further incubated at 37°C for 2 days. Cells were fixed, stained by India ink, and observed by microscope. The scale bars represent 10 μm. (B) For quantitative measurement of capsule production, cells were loaded into capillary tubes, which were subsequently placed vertically at room temperature. The relative packed capsule volume was measured by calculating the ratio of the length of packed cell volume phase to the length of the total volume phase. Three independent experiments with technical triplicates were performed. Asterisk indicate the statistical significance of difference in relative packed cell volume (##, P < 0.01; NS, not significant). The P value was calculated by one-way analysis of variance with Bonferroni's multiple-comparison test. (C) C. neoformans strains [WT (H99), cgp1Δ mutants (YSB1631 and YSB1632), and the cgp1Δ::CGP1 complemented strain (+CGP1, YSB3332)] were cultured in liquid YPD medium at 30oC for 16 h. Cells were then spotted onto the solid Niger seed medium (left panel) containing the indicated concentration of glucose. Cells were also spotted onto the L-DOPA medium (right panel) and further incubated at 25oC. Photographs were taken at 2 days. (D) Insect-based virulence test. The four C. neoformans strains described in (A) and PBS (non-infection control) were injected into Galleria mellonella (15 larvae per group) and survival was determined. The P values calculated using the Log-rank test between strains were as follows: P = 0.0010 for WT vs. cgp1Δ mutant (YSB1631), P < 0.0001 for WT vs. cgp1Δ mutant (YSB1632), and P = 0.5645 for WT vs. cgp1Δ::CGP1 (YSB3332).
![Figure 5. Cgp1 is required for C. neoformans virulence (A) For qualitative measurement of capsule production, each C. neoformans strain [WT (H99), cgp1Δ mutants (YSB1631 and YSB1632), and the cgp1Δ::CGP1 complemented strain (+CGP1, YSB3332)] was grown overnight and then spotted onto solid DME agar medium and further incubated at 37°C for 2 days. Cells were fixed, stained by India ink, and observed by microscope. The scale bars represent 10 μm. (B) For quantitative measurement of capsule production, cells were loaded into capillary tubes, which were subsequently placed vertically at room temperature. The relative packed capsule volume was measured by calculating the ratio of the length of packed cell volume phase to the length of the total volume phase. Three independent experiments with technical triplicates were performed. Asterisk indicate the statistical significance of difference in relative packed cell volume (##, P < 0.01; NS, not significant). The P value was calculated by one-way analysis of variance with Bonferroni's multiple-comparison test. (C) C. neoformans strains [WT (H99), cgp1Δ mutants (YSB1631 and YSB1632), and the cgp1Δ::CGP1 complemented strain (+CGP1, YSB3332)] were cultured in liquid YPD medium at 30oC for 16 h. Cells were then spotted onto the solid Niger seed medium (left panel) containing the indicated concentration of glucose. Cells were also spotted onto the L-DOPA medium (right panel) and further incubated at 25oC. Photographs were taken at 2 days. (D) Insect-based virulence test. The four C. neoformans strains described in (A) and PBS (non-infection control) were injected into Galleria mellonella (15 larvae per group) and survival was determined. The P values calculated using the Log-rank test between strains were as follows: P = 0.0010 for WT vs. cgp1Δ mutant (YSB1631), P < 0.0001 for WT vs. cgp1Δ mutant (YSB1632), and P = 0.5645 for WT vs. cgp1Δ::CGP1 (YSB3332).](/cms/asset/4ab0d141-3bc9-40c4-a33f-8dc58c3eb9ff/kvir_a_1423189_f0005_oc.jpg)
Figure 6. Cgp1 regulates sexual differentiation in both a positive and a negative manner at different developmental stages in C. neoformans. (A) Cgp1 is negatively involved in filament formation. The WT MATα and MATa type strains (H99 and KN99a), the MATα cgp1Δ mutant (YSB1632), the MATα cgp1Δ::CGP1 complemented strain (+CGP1, YSB3332) and the MATa cgp1Δ mutant (YSB3889), were co-cultured on V8 agar medium at room temperature in the dark for 10 days and photographed daily. (B and C) Cell fusion assay. Cells of opposite mating types were spotted onto V8 agar medium, incubated for 24 hr at room temperature in the dark, scraped, resuspended in PBS, and spread onto YPD plate containing both nourseothricin and G418. The plates were incubated for 3–4 days at 30°C and the colonies were counted. (C) Cell-fusion efficiency of unilateral and bilateral crossing was calculated relative to that of control strains [NAT-marked WTα strain (YSB119) x NEO-marked WTa strain (YSB121)]. Three independent experiments with technical triplicates were performed. (###: P value < 0.001, the error bar indicates SEM). The P value was calculated by one-way analysis of variance with Bonferroni's multiple-comparison test. (D) Morphology of dikaryotic colonies after cell fusion. Colonies grown on a YPD plate containing both nourseothricin and G418 (B) were observed under light microscopy (Olympus BX51 microscope). (E) Microscopic examination of mating structure produced in cgp1Δ mutants and wild type during mating process. Cells mixed with each mating partner were streaked in a straight line on V8 agar medium. Filamentous growth was observed at 6 day after mating, and basidium, basidiospores, or clamp connection was observed at 9 day after mating. The clamp connection was stained with 2% calcofluor-white during 30 min for fluorescent visualizing.
![Figure 6. Cgp1 regulates sexual differentiation in both a positive and a negative manner at different developmental stages in C. neoformans. (A) Cgp1 is negatively involved in filament formation. The WT MATα and MATa type strains (H99 and KN99a), the MATα cgp1Δ mutant (YSB1632), the MATα cgp1Δ::CGP1 complemented strain (+CGP1, YSB3332) and the MATa cgp1Δ mutant (YSB3889), were co-cultured on V8 agar medium at room temperature in the dark for 10 days and photographed daily. (B and C) Cell fusion assay. Cells of opposite mating types were spotted onto V8 agar medium, incubated for 24 hr at room temperature in the dark, scraped, resuspended in PBS, and spread onto YPD plate containing both nourseothricin and G418. The plates were incubated for 3–4 days at 30°C and the colonies were counted. (C) Cell-fusion efficiency of unilateral and bilateral crossing was calculated relative to that of control strains [NAT-marked WTα strain (YSB119) x NEO-marked WTa strain (YSB121)]. Three independent experiments with technical triplicates were performed. (###: P value < 0.001, the error bar indicates SEM). The P value was calculated by one-way analysis of variance with Bonferroni's multiple-comparison test. (D) Morphology of dikaryotic colonies after cell fusion. Colonies grown on a YPD plate containing both nourseothricin and G418 (B) were observed under light microscopy (Olympus BX51 microscope). (E) Microscopic examination of mating structure produced in cgp1Δ mutants and wild type during mating process. Cells mixed with each mating partner were streaked in a straight line on V8 agar medium. Filamentous growth was observed at 6 day after mating, and basidium, basidiospores, or clamp connection was observed at 9 day after mating. The clamp connection was stained with 2% calcofluor-white during 30 min for fluorescent visualizing.](/cms/asset/ea872e8f-cb80-419b-a84d-073e1b5d4e6d/kvir_a_1423189_f0006_oc.jpg)
Figure 7. The CAP-Gly domain is required for the function of Cgp1. (A) Schematic diagram of domain deletion construction (cgp1Δ::CGP1CAP-GlyΔ, cgp1Δ::CGP1SPECΔ, cgp1Δ::CGP1SPC7Δ). (B) The role of each Cgp1 domain in microtubule stability and genotoxic stress responses. Each strain [WT (H99), cgp1Δ mutants (YSB1631 and YSB1632), the cgp1Δ::CGP1 complemented strain (+CGP1, YSB3332), cgp1Δ::CGP1CAP-GlyΔ strains (+CGP1CAP-GlyΔ, YSB3897 and YSB3901), cgp1Δ::CGP1SPECΔ strains (+CGP1SPECΔ, YSB3949 and YSB3957), and cgp1Δ::CGP1SPC7Δ strains (+CGP1SPC7Δ, YSB3905 and YSB3907] was grown on YPD medium. The grown cells were serially diluted 10-fold and spotted onto YPD agar medium containing the indicated concentration of TBZ (7.5 µg/mL), 5-FC (300 µg/mL) or SDS (0.03%), further incubated at 30°C and photographed daily for 2–4 days. (C) The function of each Cgp1 domain in C. neoformans sexual differentiation. The following MATα and MATa strains were crossed unilaterally or bilaterally on V8 agar medium and cultured at room temperature in the dark for 10 days and photographed daily: WTα (H99), WTa (KN99a), α cgp1Δ (YSB1632), a cgp1Δ (YSB3889), α cgp1Δ::CGP1CAP-GlyΔ (YSB3897), α cgp1Δ::CGP1SPECΔ (YSB3949), and α cgp1Δ::CGP1SPC7Δ (YSB3905).
![Figure 7. The CAP-Gly domain is required for the function of Cgp1. (A) Schematic diagram of domain deletion construction (cgp1Δ::CGP1CAP-GlyΔ, cgp1Δ::CGP1SPECΔ, cgp1Δ::CGP1SPC7Δ). (B) The role of each Cgp1 domain in microtubule stability and genotoxic stress responses. Each strain [WT (H99), cgp1Δ mutants (YSB1631 and YSB1632), the cgp1Δ::CGP1 complemented strain (+CGP1, YSB3332), cgp1Δ::CGP1CAP-GlyΔ strains (+CGP1CAP-GlyΔ, YSB3897 and YSB3901), cgp1Δ::CGP1SPECΔ strains (+CGP1SPECΔ, YSB3949 and YSB3957), and cgp1Δ::CGP1SPC7Δ strains (+CGP1SPC7Δ, YSB3905 and YSB3907] was grown on YPD medium. The grown cells were serially diluted 10-fold and spotted onto YPD agar medium containing the indicated concentration of TBZ (7.5 µg/mL), 5-FC (300 µg/mL) or SDS (0.03%), further incubated at 30°C and photographed daily for 2–4 days. (C) The function of each Cgp1 domain in C. neoformans sexual differentiation. The following MATα and MATa strains were crossed unilaterally or bilaterally on V8 agar medium and cultured at room temperature in the dark for 10 days and photographed daily: WTα (H99), WTa (KN99a), α cgp1Δ (YSB1632), a cgp1Δ (YSB3889), α cgp1Δ::CGP1CAP-GlyΔ (YSB3897), α cgp1Δ::CGP1SPECΔ (YSB3949), and α cgp1Δ::CGP1SPC7Δ (YSB3905).](/cms/asset/81037504-e893-46f6-bc28-9fade36996cc/kvir_a_1423189_f0007_oc.jpg)
Figure 8. Overexpression of CGP1 perturbs microtubule stability and normal mating efficiency. (A) CGP1 overexpression decreases microtubule stability. The WT (H99), the cgp1Δ mutant (YSB1631), and the CGP1 overexpression strains (PH3:CGP1, YSB3663 and YSB3665) were cultured overnight in YPD medium, serially diluted 10-fold, and spotted onto YPD agar medium containing the indicated concentration of TBZ (7.5 µg/mL), 5-FC (500 µg/mL), HU (90 mM), MMS (0.03%), SDS (0.03%), or AMB (1 µg/mL). (B) CGP1 overexpression promotes filament formation. The following MATα and MATa strains were crossed unilaterally or bilaterally on V8 agar medium and cultured at room temperature in the dark for 10 days and photographed daily: WTα (H99), WTa (KN99a), α cgp1Δ (YSB1632), a cgp1Δ (YSB3889), α PH3:CGP1 (YSB3663).
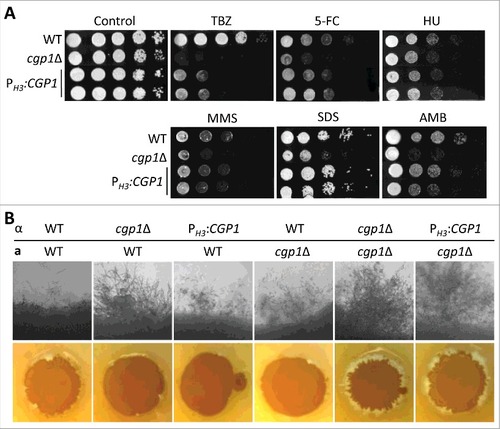
Figure 9. Cgp1-related regulatory networks. Functional network analysis of the Cgp1-related proteins in C. neoformans using CryptoNet. This gene-function correlation was based on 100 function-related candidate genes to Cgp1-interacting proteins as a gene query, and the network picture was drawn using Cytoscape 3.2.1 version. Genes in this network were classified based on their Gene Ontology (GO) term or their predicted biological functions listed in Table S4.