Figures & data
Figure 1. Enterococci proliferate in and cause distention of the C. elegans intestine, but do not invade intracellularly or lyse intestinal cells. Transmission electron micrographs of transverse midbody sections of N2 C. elegans feeding on E. coli OP50 (A, D, G), E. faecalis MMH594 (B, E, H), or E. faecium E007 (C, F, I) at 8 hours (A-C), 24 hours (D-F), or 48 hours (G-I) post infection. Representative micrographs are shown. The microvilli (mv) and cytoplasm of an intestinal epithelial cell (iec) are marked. Sites of dehiscence of the terminal web from the luminal membrane are marked with an asterisk. Scale bar, 2 µm.
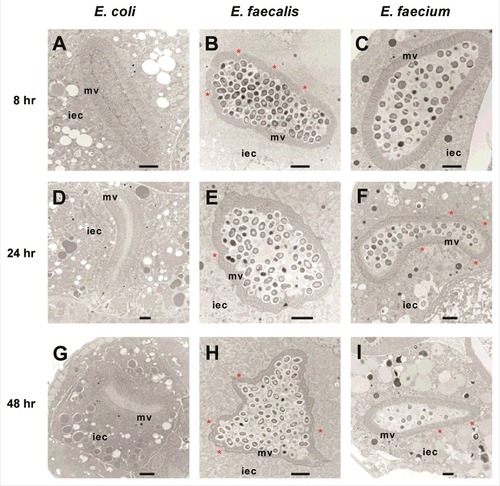
Figure 2. BAR-1, FSHR-1, and PMK-1 are required for defense against both E. faecalis and E. faecium. (A, B) Survival of wild-type N2, pmk-1(km25), fshr-1(ok778), and pmk-1(km25);fshr-1(ok778) C. elegans on E. faecalis (left) and wild-type N2, pmk-1(km25), bar-1(ga80), and pmk-1(km25);bar-1(ga80) animals (right) on E. faecalis (A) and E. faecium (B), sterilized with cdc-25.1 RNAi. (C) Survival of N2 and pmk-1(km25) worms sterilized with cdc-25.1 RNAi on heat-killed E. faecalis. Each graph shows the average of three plates for each strain, with each plate containing 30–40 worms. Results are representative of 3 independent assays. Statistical significance of differences between survival curves was calculated using Kaplan-Meier log rank analysis. Strains that showed a statistically significant difference from N2 are denoted with an asterisk and bracket. (D) Bacterial load of wild-type N2 and pmk-1 C. elegans after infection with E. faecalis or E. faecium. Time course of colony forming units in the intestines of wild-type N2 or pmk-1 deficient C. elegans, sterilized with cdc-25.1, and infected with either E. faecalis or E. faecium. Error bars represent the standard deviation. Results are representative of 2 independent assays; each condition of each experiment was performed in triplicate or quadruplicate.
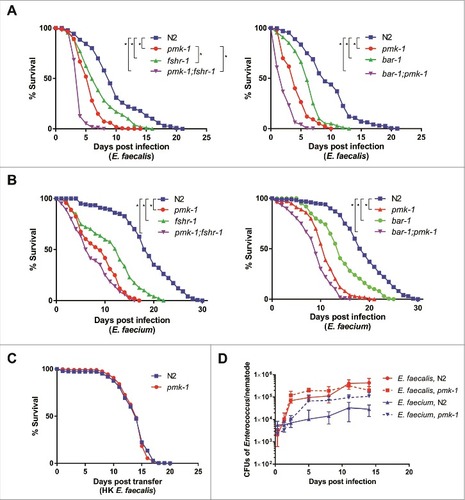
Figure 3. Live E. faecalis perturbs defecation cycle length in C. elegans. (A) Sequential defecation cycle lengths (time between consecutive contractions of the posterior body wall muscle) in wild-type C. elegans fed on E. coli, E. faecalis, or E. faecium. (B) Defecation cycle lengths in L4 worms fed E. coli, E. faecalis, or E. faecium, either live or heat-killed, for 24 hours. Mean defecation cycle lengths are indicated with horizontal bars. Results are representative of 3 independent assays. Relevant statistically significant differences are indicated with a bracket. Statistical significance was calculated using an unpaired t-test and the Holm-Sidak method for multiple comparison correction.
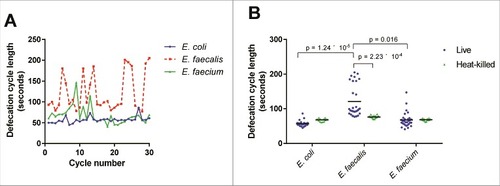
Figure 4. Enterococcus infection gene signature. (A) Fold-change by fold-change plot, depicting E. faecalis-infected C. elegans with E. faecium-infected C. elegans (relative to heat-killed E. coli-fed controls). Genes differentially expressed by both E. faecalis and E. faecium (relative to HK E. coli, |FC| > 2) are highlighted in aquamarine. 18,477 annotated Affymetrix probes were found to not be differentially expressed in either comparison. (B) The set of differentially expressed genes (|FC| > 2, BH-adjusted p-value < 0.05) in the E. faecalis infection signature (375) shared a significant overlap with genes differentially expressed in the E. faecium infection (399), p = 1.37 × 10295. (C) Functional classification summary of the differentially expressed genes that are exclusive to either E. faecalis (left) or E. faecium (right), relative to heat-killed E. coli. Similar functional categories of GO terms were clustered together in two-dimensional space using REViGO, a visualization tool that uses a clustering algorithm to represent GO data by plotting their semantic similarity. The bubble color indicates the Fisher test statistic while the bubble size is proportional to the frequency of GO terms in the GO annotation database. Colors corresponding to log10 Fisher test statistic are provided in the legend.)
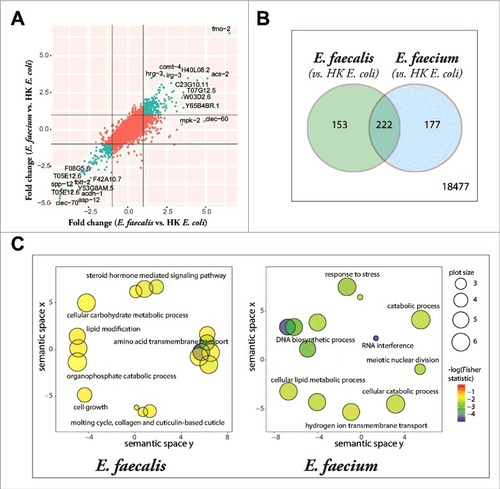
Figure 5. Induction of Enterococcus-activated genes through known C. elegans immune pathways and by heat-killed bacteria. (A) Heat-map of Enterococcus-activated genes in wild-type N2 worms or immune pathway mutant worms (pmk-1(km25), bar-1(ga80), pmk-1(km25);bar-1(ga80), and fshr-1(ok778)), during infection with E. faecalis (top panel) or E. faecium (bottom panel). The heat-map reflects data from 2–3 biological replicates for each mutant analyzed. (b) Heat-map of Enterococcus-activated genes in wild-type N2 or immune pathway mutant worms, after 8 hours of exposure to heat-killed E. faecalis (top panel) or heat-killed E. faecium (bottom panel). For comparison, induction in N2 wild-type worms by live E. faecalis or E. faecium is shown in the bottom row of each panel. The heat-map reflects data from 2–3 biological replicates for each mutant analyzed. Genes are ordered by their degree of induction on E. faecalis in N2 worms, from red (most highly upregulated) to blue (most highly downregulated).
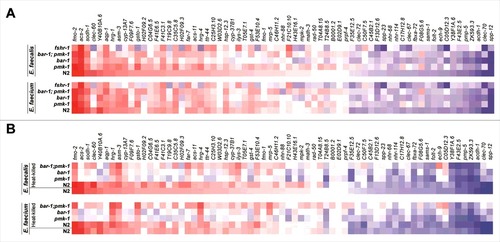
Figure 6. Stress response pathways are required for defense against Enterococcus. (a) Heat-map of the fold-changes of Enterococcus-activated genes in N2 worms treated with RNAi against C. elegans small RNA pathway components (drsh-1, drh-3, dcr-1 or rde-1) (two panels on left) or stress response pathway components (hif-1, kgb-1, or skn-1) (two panels on right) or vector control (L4440) during infection with E. faecalis or E. faecium relative to heat-killed E. coli control. The heat-map reflects data from 2 biological replicates for each mutant analyzed. (b) Effect of Enterococcus infection on the survival of fer-15(b26);fem-1(hc17) C. elegans treated with L4440 vector control, drsh-1, drh-3, dcr-1 or rde-1 RNAi. (c) Effect of Enterococcus infection on the survival of fer-15;fem-1 C. elegans treated with L4440 vector control, kgb-1, hif-1 or skn-1 RNAi strains. For (b) and (c), each graph shows the average of three plates for each strain, with each plate containing 30–40 worms. results are representative of 3 independent assays and statistical significance of differences between survival curves was calculated using Kaplan-Meier log rank analysis. Relevant statistically significant survival curves (relative to control) are marked with asterisks.
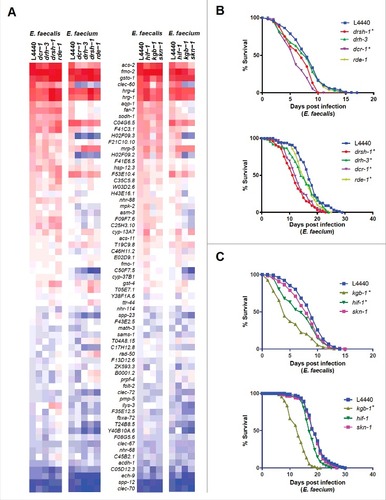
Figure 7. Nuclear hormone receptors are required for defense against Enterococcus. (a) Effect of E. faecalis and E. faecium infection on the survival of wild-type N2 and nhr-114(gk849). (b) Effect of E. faecalis and E. faecium infection on fer-15(b26);fem-1(hc17) C. elegans treated with L4440 vector control or nhr-144 RNAi. Results are representative of 2 independent assays. Each graph shows the average of three plates for each strain, with each plate containing 30–40 worms. Relevant statistically significant survival curves (relative to control) are marked with asterisks and a bracket. Statistical significance of differences between survival curves was calculated using Kaplan-Meier log rank analysis.
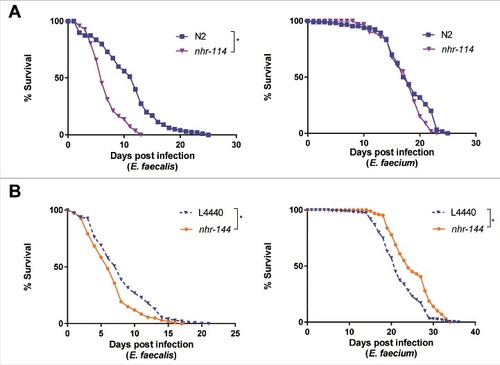
Figure 8. Pre-exposure to heat-killed Enterococci protects against subsequent infection with live E. faecalis. Survival of fer-15(b26);fem-1(hc17) worms exposed to 8 hours of heat-killed bacteria (E. coli, E. faecalis, or E. faecium) or live bacteria (E. faecalis or E. faecium) and then transferred to live E. faecalis. Each graph shows the average of three plates for each condition, with each plate containing 30–40 worms. Results are representative of 2 independent assays. Statistically significant (p<0.05) survival curves that were increased in resistance (relative to HK E. coli) are marked with an asterisk and bracket. Statistical significance of differences between survival curves was calculated using Kaplan-Meier log rank analysis.