Figures & data
Figure 1. HU protein is a prerequisite for effective Francisella proliferation inside BMMs. Significant difference in ability of intracellular growth is evident at 6 h after infection. Mutant strain is not able to replicate in murine macrophages as effectively as both WT and complemented strains. P value < 0.05 #, P < 0.01 ##, P < 0.001 ###, P < 0.0001 ####.
Figure 2. FSC200/hupB mutant is attenuated in in vivo model of tularemia. Groups BALB/c mice, 6–10 weeks old, were infected with 200 μl of bacterial suspension subcutaneously (s.c.) with appropriate infection doses of 101, 102, 103, 104, 105 and 106 CFU/mouse for FSC200/hupB mutant and 102 CFU/mouse for FSC200 and complemented strain FSC200/hupB+hupB. Mice infected by FSC200 died within 8 days after infection. In contrast, neither increasing infection doses of FSC200/hupB cause the death of mice.
Figure 3. Proteins exhibiting decreased synthesis. Diagram shows groups of proteins with reduced synthesis in hupB null mutant that were detected in iTRAQ analysis. The number of these proteins is indicated in the brackets. Associated with: RNA (16), DNA (15), Type VI secretion system (15), transport (14), cell division (13), oxidative and another stress response (12), LPS biosynthesis (12), pyrimidine and purine biosynthesis (11), protein and amino acid biosynthesis (9), carbon metabolism (9), transcription and translation (9), enzymes (8), cell redox homeostasis (6) and other [FeS cluster assembly (6), tryptofan biosynthesis (5), panthothenate biosysnthesis (3), vitamin B (3), glycerol metabolism (3), pilus assembly (3), kinases (2), antibiotic response (1)].
![Figure 3. Proteins exhibiting decreased synthesis. Diagram shows groups of proteins with reduced synthesis in hupB null mutant that were detected in iTRAQ analysis. The number of these proteins is indicated in the brackets. Associated with: RNA (16), DNA (15), Type VI secretion system (15), transport (14), cell division (13), oxidative and another stress response (12), LPS biosynthesis (12), pyrimidine and purine biosynthesis (11), protein and amino acid biosynthesis (9), carbon metabolism (9), transcription and translation (9), enzymes (8), cell redox homeostasis (6) and other [FeS cluster assembly (6), tryptofan biosynthesis (5), panthothenate biosysnthesis (3), vitamin B (3), glycerol metabolism (3), pilus assembly (3), kinases (2), antibiotic response (1)].](/cms/asset/d2219331-b336-46df-9f97-bf311cfeab8c/kvir_a_1441588_f0003_oc.jpg)
Figure 4. Proteins exhibiting increased synthesis. Diagram shows groups of proteins with increased synthesis in hupB null mutant that were detected in iTRAQ analysis. The number of these proteins is indicated in the brackets. Associated with: Amino acid metabolism (25), transport (23), saccharide metabolism (20), cell division (17), cell redox homeostasis (17), Krebs cycle (12), enzymes (11), protein biosynthesis (11), fatty acid metabolism (10), RNA (7), stress response (7), transcription and translation (7), DNA (6), lipid metabolism (3) and other [pyrimidine and purine biosynthesis (5), nucleotide metabolism (7), antibiotic response (1), capsule and LPS (2), cyanophycin (2), terpenoid (2), vitamin biosynthesis (3), iron and nitrogen (4)].
![Figure 4. Proteins exhibiting increased synthesis. Diagram shows groups of proteins with increased synthesis in hupB null mutant that were detected in iTRAQ analysis. The number of these proteins is indicated in the brackets. Associated with: Amino acid metabolism (25), transport (23), saccharide metabolism (20), cell division (17), cell redox homeostasis (17), Krebs cycle (12), enzymes (11), protein biosynthesis (11), fatty acid metabolism (10), RNA (7), stress response (7), transcription and translation (7), DNA (6), lipid metabolism (3) and other [pyrimidine and purine biosynthesis (5), nucleotide metabolism (7), antibiotic response (1), capsule and LPS (2), cyanophycin (2), terpenoid (2), vitamin biosynthesis (3), iron and nitrogen (4)].](/cms/asset/bd2c39b0-f830-46ba-b49b-3be1ca61754e/kvir_a_1441588_f0004_oc.jpg)
Figure 5. PigR and IglG exhibit decreased synthesis in FSC200/hupB mutant. Targeted quantification approach was used for evaluation of PigR and IglG protein levels. Normalized peptide levels for (A) HU peptide SELVSAIAK, (B) HU peptide EVASNTLDATIAAVTK, (C) PigR peptide ANQYSGNFEQIVK, (D) PigR peptide EGLSYQDAEK; and (E) IglG peptide TLTNNLPASNITDSK are shown. PigR exhibits significantly decreased synthesis in the mutant strain in the contrast to WT. P value < 0.05 #, P < 0.01 ##, P < 0.001 ###, P < 0.0001 ####.
Figure 6. Semi-quantitative RT-PCR demonstrates decreased transcription level of pigR gene. Expression of pigR was verified on transcription level using reverse transcription followed by PCR. Samples were analyzed by gel electrophoresis and intensities of bands were determined by Bio1D software (CertainTech). pigR showed significantly decreased expression in mutant strain in contrast to WT, whereas the transcription level of rpoA remained unchanged. This result suggests HU participation in pigR regulation. P value < 0.05 #, P < 0.01 ##, P < 0.001 ###, P < 0.0001 ####.
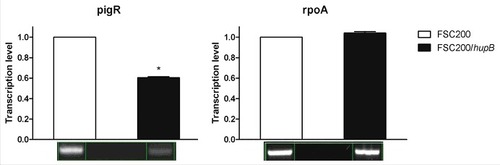
Figure 7. FSC200/hupB mutant is less resistant to human serum than WT. FSC200, FSC200/hupB, FSC200/hupB+hupB and FSC200/wbtDEF::Cm strains were incubated with human nonimmune serum and their resistance/susceptibility was determined by CFU counts. FSC200/wbtDEF::Cm strain is highly susceptible to the effects of complement and the strain was used as a positive control for serum complement activity. Data are presented as percent survival (i.e., CFU obtained from incubations in a serum normalized to CFU from incubations in PBS). Means ± SD from three independent experiments are given. Mutant strain shows less resistance to human serum than WT and complemented strain. P value < 0.05 #, P < 0.01 ##, P < 0.001 ###, P < 0.0001 ####.
Figure 8. FSC200/hupB mutant is more sensitive to oxidative stress stimuli than WT. Oxidative stress survival. (A) Bacteria were grown in the presence of 20 μM CuCl2 and the optical density (600 nm) was measured using microplate reader FLUOstar Optima. Significant difference in growth was evident after 24 h measurement. (B) Oxidative stress induced using 0.03% hydrogen peroxide. The bacteria were plated on chocolate agar plates at different times after H2O2 addition, and viable bacteria were monitored 3 days after. Mutant growth is limited by oxidative stress conditions induced by both CuCl2 and H2O2. P value < 0.05 #, P < 0.01 ##, P < 0.001 ###, P < 0.0001 ####.
Figure 9. FtHU binds to dsDNA. Gel electrophoresis of FtHU-DNA complex. Lanes 1 and 8 standards, lane 2 naked DNA, lanes 3,4,5,6, and 7 DNA with FtHU (0.5; 0.7; 0.9; 1; 1.2 μg), lanes 9,10,11,12,and 13 DNA with BSA (0.5; 0.7; 0.9; 1; 1.2 μg). FtHU-DNA complex migrates slower in agarose gel and it is localized higher than control sample with BSA.
Figure 10. FtHU protects DNA from oxidative damage. The ability of FtHU to protect DNA from free hydroxyl radicals was tested. Samples were analyzed on 1% agarose gel and visualized by SYBR®Safe DNA gel stain. BSA protein was used as a negative control. 1 and 10 standards, 2 DNA, 3 DNA + H2O2, 4 DNA + H2O2 + Fe2+ (166 μM), 5–9 DNA + H2O2 + FtHU + Fe2+ (0 μM, 166 μM, 333 μM, 666 μM, 1000 μM), 11–15 DNA + H2O2 + BSA + Fe2+ (0 μM, 166 μM, 333 μM, 666 μM, 1000 μM). Even in case of increasing concentrations of Fe2+ HU is able to protect DNA from reactive oxygen species.