Figures & data
Figure 1. Screening the cellular proteins interacting with NDV M protein through yeast two-hybrid assay. (A) The bait plasmid pGBKT7-M transformed AH109 was mated with yeast Y187 containing pGADT7-Rec with the cDNA library of DF-1 cells. The suspected positive colonies were screened on the auxotrophic medium SD/-Trp/-Leu/-His/-Ade. N0.1 was the negative control and no.2 was the positive control. (B) The yeast colonies obtained from (A) were cultured on the SD/-Trp/-Leu/-His/-Ade/X-α-gal medium. The colonies growing on this medium and turning blue are the indication of interaction of the two expressed proteins. (C) The yeast colonies obtained from (A) were transferred into nitrocellulose filters and assayed for β-galactosidase activity to verify the interaction between NDV M protein and the cellular proteins.
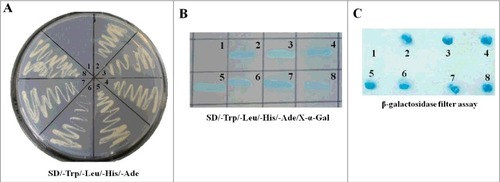
Table 1. Comparison between positive clones and similar sequences in GenBank.
Figure 2. NDV M protein interacts with importin β1 in vivo and in vitro. (A) Reciprocal co-immunoprecipitation assay of Myc-importin β1 and NDV M protein in DF-1 cells. DF-1 cells transfected with plasmid expressing Myc-importin β1 were infected with NDV at an MOI of 0.1. Cells were lysed at 24 h post-infection, and co-immunoprecipitation assay was performed using either anti-Myc (middle panel) or anti-M (lower panel) antibodies. Immunoprecipitated proteins were detected by Western blotting using anti-M or anti-Myc antibodies. (B) The interaction between M and importin β1 was verified by GST pull-down assay. GST or GST-M or His-importin β1 protein was expressed in E. coli BL21 (DE3) and purified on Glutathione-Sepharose beads or His#Bind resins, respectively. The purified GST or GST-M protein (3 μg) was immobilized on Gluthatione-Sepharose beads and then incubated with the purified His-importin β1 (3 μg) for 2 h at 4°C. The beads were washed with transport buffer and the bound proteins were eluted from the beads and detected by Western blotting. (C and D) GST-M/NLSm or His-importin β1(△336-433) was expressed in E. coli BL21 (DE3) and then purified as described above. GST pull-down and His pull-down assays were performed to identify the interaction domains between M and importin β1.
Figure 3. M/NLS mutation reduces the replication ability of NDV in cells. (A) The immunofluorescence assay was used to examine the subcellular localization of NDV M protein in rSS1GFP and rSS1GFP-M/NLSm infected DF-1 cells at 12 hpi. DAPI was used to stain nuclei. Original magnification was 1 × 200. (B) The shape and size of plaques formed by rSS1GFP and rSS1GFP-M/NLSm in DF-1 cells. DF-1 cells in six-well plates were infected with serial tenfold dilutions of the virus for 1 h. After adsorption, the inoculum was removed and replaced with the medium containing 2% FBS and 1% agar. The overlay medium supplemented with 0.1% neutral red was added after 36 h incubation. Plaques were observed after a further 48 h of incubation. (C) Virus titers were determined in DF-1 cells at the indicated time points. Each data point on the curve indicates the mean ± SD of three independent experiments. P values < 0.001 are represent with### and p values <0.01 are represent with ##. (D) The CPE was observed in virus-infected DF-1 cells at the indicated time points. The images were obtained using the phase-contrast microscope. Original magnification was 1 × 200.
Table 2. Biological characteristics of the parental and mutant virusesFootnote#.
Figure 4. M/NLS mutation attenuates the replication and pathogenicity of NDV in chickens. (A) Survival curves of 4-week-old SPF chickens (n = 10 for each group). Birds were inoculated with rSS1GFP or rSS1GFP-M/NLSm at a dose of 105.0 EID50/100 μL per bird, or with 100 μL PBS as the negative control. The birds were monitored for clinical signs daily for 10 dpi. (B) Viral load in the collected tissues of 4-week-old chickens (n = 3) infected with the two viruses at 5 dpi. Viral titers were determined in DF-1 cells and presented as log10TCID50 g−1 tissue. Asterisks indicate a statistically significant difference between the titers of the two viruses. P values < 0.001 are represent with###. (C) Histopathology of lymphoid tissue samples collected from rSS1GFP or rSS1GFP-M/NLSm or PBS-inoculated 4-week-old chickens. Birds were sacrificed at 5 dpi, and the tissues were fixed with 10% neutral formalin, sectioned, and stained with hematoxylin-eosin.
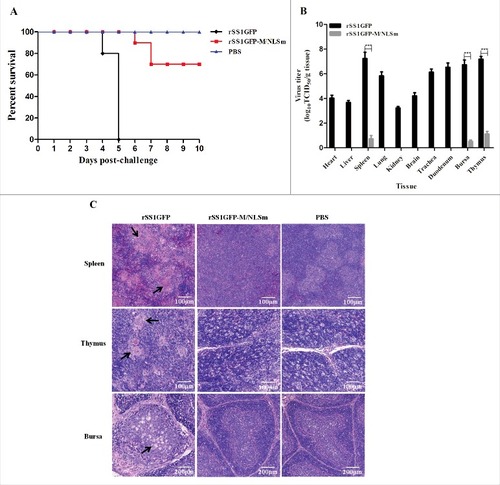
Figure 5. Nuclear import of NDV M protein requires importin β1 and RanGTP. (A) DF-1 cells were transiently co-transfected with the plasmid pEGFP-M and plasmids encoding DsRed-DN-importin α5, DsRed-DN-importin β1, DsRed-M9M, DsRed-Bimax2, DsRed-RanQ69L or DsRed-NTF2/E42K, respectively. The subcellular localization of the fusion proteins was observed under fluorescence microscope at 24 h post-transfection. DAPI was used to stain nuclei. Original magnification was 1 × 200. (B) The intracellular distribution of the fusion protein EGFP-M obtained from (A) was detected by Western blotting. Lamin B1 for the nucleus and tubulin for the cytoplasm were used as cellular markers. N represents the nucleus and C represents the cytoplasm. (C) Digitonin-permeabilized HeLa cells were incubated with GST-M-GFP in the presence of cytosol, importin β1, RanGTP, RanGDP, importin β1 plus RanGTP, importin β1 plus RanGDP, or importin β1 plus RanQ69LGTP. DAPI was used to stain nuclei. The GST-M-GFP protein was observed under fluorescence microscope. Original magnification was 1 × 200.
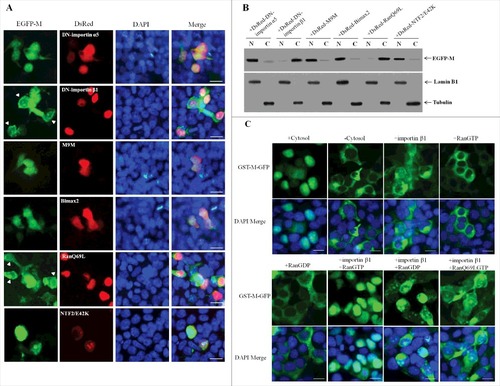
Figure 6. The nuclear import of M protein and the replication of NDV are not inhibited by ivermectin. (A) The subcellular localization of NDV M protein in virus-infected DF-1 cells treated with ivermectin or DMSO at 12 hpi. DAPI was used to stain nuclei. Original magnification was 1 × 200. (B) The intracellular distribution of NDV M protein obtained from (A) was detected by Western blotting. Lamin B1 for the nucleus and tubulin for the cytoplasm were used as cellular markers. N represents the nucleus and C represents the cytoplasm. (C) The CPE in virus-infected DF-1 cells treated with ivermectin or DMSO at 12 hpi was observed under phase-contrast microscope. Original magnification was 1 × 200. (D) The expression of GFP in virus-infected DF-1 cells was observed under fluorescence microscope and detected by Western blotting. (E) DF-1 cells were treated with the drug ivermectin or DMSO and then infected with rSS1GFP at an MOI of 0.1. The cell culture supernatants were collected at 12 and 24 hpi, and the virus titers were determined as TCID50 in DF-1 cells.
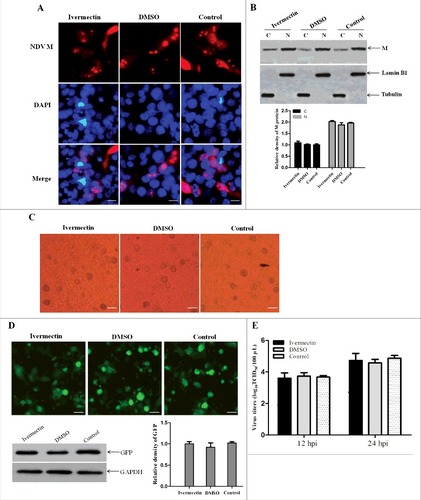
Figure 7. Importin α5 binds NDV M protein by interacting with importin β1. (A) The subcellular localization of the fusion proteins in DF-1 cells. The indicated plasmids were transfected into DF-1 cells and then used for immunofluorescence aasay at 24 h post-transfection. DAPI was used to stain nuclei. Fluorescent images were obtained under a Nikon fluorescence microscope. Original magnification was 1 × 200. (B) Characterization of the interaction between NDV M protein and the cellular transport proteins by reciprocal co-immunoprecipitation assay. DF-1 cells transfected with the plasmids were lysed at 24 h post-transfection, and co-immunoprecipitation assay was performed using either anti-HA (upper panel) or anti-Myc (lower panel) antibodies. Immunoprecipitated proteins were detected by Western blotting using anti-Myc or anti-HA antibodies. (C) Identification of the interaction between importin α5 and M or importin β1 by pull-down assay. The purified GST-M or GST-importin β1 protein was immobilized on Gluthatione-Sepharose beads and then incubated with the purified His-importin α5. The bound proteins were eluted from the beads and examined by Western blotting. (D) Protein binding assay was used to identify the interaction among M, importin α5 and importin β1. Lane 1 was GST-M alone, lane 2 was GST-M plus His-importin α5, lane 3 was GST-M plus His-importin β1, lane 4 was GST-M plus His-importin α5 together with His-importin β1.
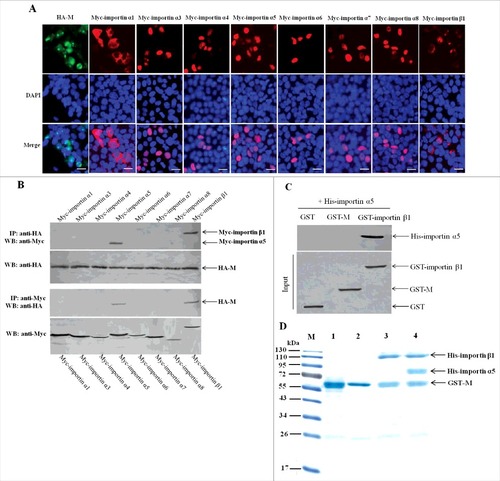
Figure 8. Importin α5 reduces importin β1-mediated nuclear import of NDV M protein. (A and B) Effects of importin β1 or importin α5 RNAi on the expression of endogenous importin β1 or importin α5, respectively. DF-1 cells were transfected with importin β1 or importin α5 siRNA (#1-3) or control siRNA. After 48 h transfection, cell lysates were prepared and examined by Western blot with anti-importin β1 or anti-importin α5 antibody. Endogenous GAPDH expression was used as internal control. (C) DF-1 cells were transfected with importin β1 siRNA or importin α5 siRNA or control siRNA. Forty-eight hours after transfection, cells were infected with rSS1GFP at an MOI of 1. The subcellular localization of NDV M protein in virus-infected DF-1 cells was detected at 6 hpi and 12 hpi, respectively. DAPI was used to stain nuclei. Original magnification was 1 × 200. (D) Immunoblot analysis of the intracellular distribution of M in importin β1 siRNA- or importin α5 siRNA- or control siRNA-treated DF-1 cells. N represents the nucleus and C represents the cytoplasm.
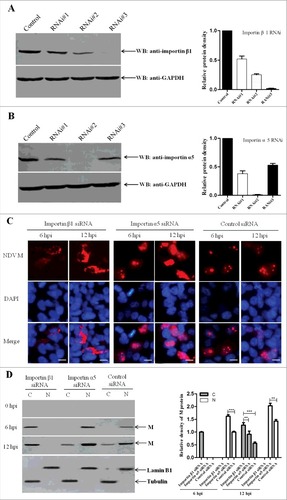
Figure 9. Importin α5 decreases importin β1-participated NDV replication and pathogenicity. (A) Normal cells, RNAi control cells, importin β1-RNAi cells and importin α5-RNAi cells were infected with rSS1GFP at an MOI of 1. Twenty-four hours after infection, the CPE was observed under phase-contrast microscope. (B) The expression of GFP obtained from (A) was observed under fluorescence microscope and detected by Western blotting. (C and D) Normal cells, RNAi control cells, importin β1-RNAi cells and importin α5-RNAi cells were infected with rSS1GFP at an MOI of 1. At different time points (6, 12, 24, 48 and 72 hpi), the viral loads in the cell culture supernatants (C) and cell pellets (D) were determined by TCID50 in DF-1 cells. The graphs showed the average of viral titers in DF-1 cells from three independent experiments. (E and F) qRT-PCR was used to examine the mRNA expression levels of NDV M gene in the cell culture supernatants (E) and cell pellets (F) obtained from (C) and (D) at 24 h post-infection, respectively. The graphs showed the average of mRNA levels of NDV M gene in DF-1 cells from three independent experiments. P values < 0.001 are represent with### and p values <0.01 are represent with ##.
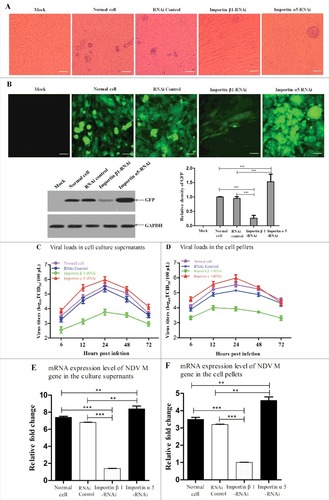
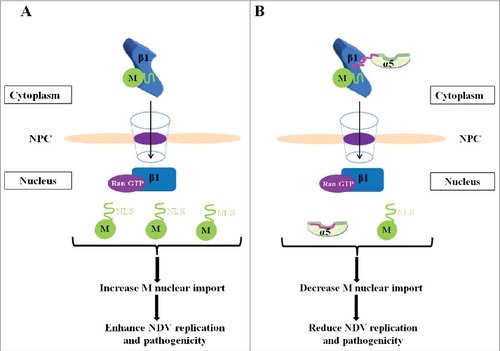
Figure 10. The schematic diagram of the negative regulation role of importin α5 in importin β1-mediated nuclear import of M protein and the replication and pathogenicity of NDV.