Figures & data
Figure 1. Pyoverdine translocates into C. elegans, extracts host iron, and exits the host. (A) Pyoverdine fluorescence was measured in C. elegans lysates. Worms were exposed to pyoverdine-rich filtrate for the indicated amount of time, washed, and then lysed. Complexed iron was stripped from pyoverdine using 1M 8-hydroxyquinoline before measurement. (B) Pyoverdine fluorescence was measured in C. elegans cellular debris, cellular membranes, or soluble protein fractions. (C, D) Maxmium projection of confocal laser scanning microscopy images of pyoverdine fluorescence in glp-4(bn2) mutant worm tissue after exposure to pyoverdine-rich filtrate (C) or the same filtrate pre-saturated with iron (D). Blue indicates fluorescence of iron-free pyoverdine, red shows CellMask plasma membrane stain. Images were collected using identical settings. (E) Fluorescence of pyoverdine-rich filtrate after 24h incubation in the presence or absence of C. elegans. (F) Pyoverdine fluorescence in the lysates of worms exposed to pyoverdine for 16 h (pulse), and then incubated in pyoverdine-free medium for 0, 2, or 6 h (chase). Total levels of pyoverdine were measured after complexed iron was extracted with 1M 8-hydroxyquinoline. (G) ICP-MS analysis of total iron concentration in worms exposed to either pyoverdine-rich filtrate, filtrate from a pyoverdine biosynthesis mutant pvdA, or media control. (H) Relative amount of ferric iron in the lysates of worms exposed to filtrate from pyoverdine-free media (E. coli OP50), pyoverdine-rich filtrate from wild-type P. aeruginosa, or filtrate from a P. aeruginosa pvdA. Asterisks or hashes indicate significant difference between conditions (p-value < 0.01 or < 0.05, correspondingly) based on Student's t-test. Error bars represent SEM of three independent biological replicates.
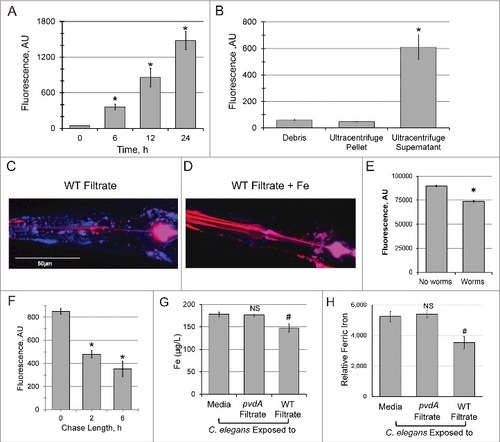
Figure 2. Exposure to pyoverdine damages host mitochondria. (A, B) Visualization of a Peredox fluorescence reporter bound to NADH, normalized to a constitutively-expressed, RFP-tagged protein (A) or GFP fluorescence from a PINK-1::GFP reporter, normalized to a constitutively-expressed, RFP-tagged protein (B). Worms were exposed to pyoverdine-rich or pvdA filtrate, pyoverdine-rich filtrate saturated with iron, or media. (C, D) Quantification of fluorescence for the conditions above. At least 150 worms were analyzed for each biological replicate (approximately 50 worms per image). (E) Relative quantification of mitochondrial:nuclear genome copy number in worms exposed to pyoverdine-rich filtrate or filtrate from PA14pvdA (control). (F) Fluorescence of the mtRosella reporter in worms treated with wild-type filtrate or wild-type filtrate pre-saturated iron. The GFP signal is sensitive to low pH, and loses fluorescence within autophagolysosomes. (G) Bioluminescence of a GFP-tagged luciferase in C. elegans exposed to pyoverdine-rich filtrate or media control. Light and GFP fluorescence were measured 1 hour after the addition of luciferin. Luminescence was normalized to GFP fluorescence to control for differences in protein expression. Data presented in A, B, F, and G are one representative result from four biological replicates. Data presented in E are the average from three biological replicates. Error bars in C, D, E, G represent SEM. Asterisks indicate p-value < 0.01, hashes are p < 0.05, based on Student's t-test.
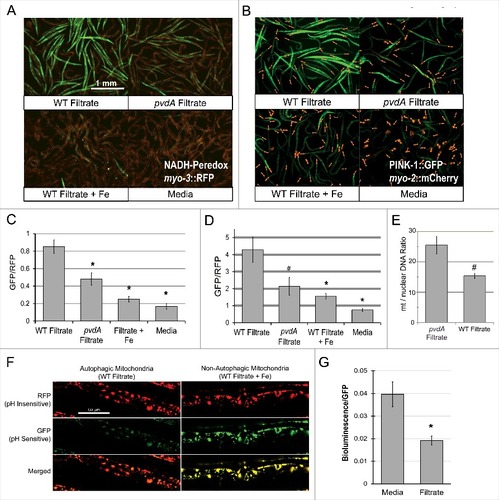
Figure 3. Purified pyoverdine translocates into the host and activates mitophagy. (A, B) Confocal laser scanning microscopy images of pyoverdine fluorescence in glp-4(bn2) mutant worm tissue after exposure to purified pyoverdine without (A) or with (B) iron supplementation. Images were collected using identical settings. (C, D) Visualization (C) and quantification (D) of a Peredox fluorescence reporter normalized to a constitutively-expressed, RFP-tagged protein. Worms were exposed to purified pyoverdine or media. (E, F) Visualization (E) and quantification (F) of a PINK-1::GFP fluorescence reporter. GFP fluorescence was normalized to a constitutively-expressed RFP signal. Data presented in (A-F) are one representative result from four biological replicates. At least 150 worms were analyzed for each biological replicate (approximately 50 worms per image). Error bars in D, F represent SEM. Asterisks indicate p-value < 0.01, based on Student's t-test.
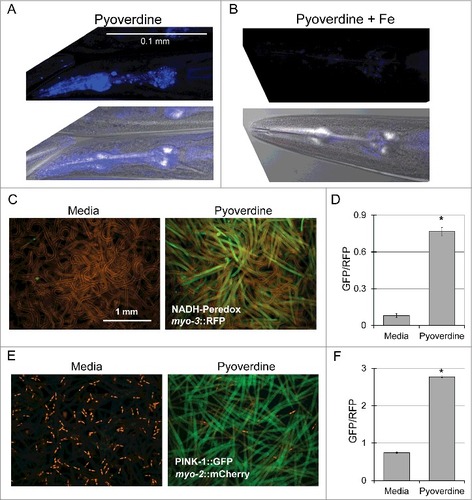
Figure 4. Pyoverdine exposure activates a distinct host response. (A) A Venn diagram of genes upregulated after exposure to pyoverdine and P. aeruginosa infection on agar and ToxA. (B) qRT-PCR analysis of a panel of genes upregulated by exposure to pyoverdine (gray), P. aeruginosa (black), or E. coli OP50 (white) in liquid as compared to untreated worms (which remained on NGM agar with E. coli OP50 food). (C) qRT-PCR analysis response to phenanthroline, with fold changes normalized to worms exposed to solvent control (DMSO) in liquid. (D) Venn diagram of genes upregulated after exposure to pyoverdine, P. aeruginosa, and phenanthroline in liquid. (E) Statistical significance of overlaps between microarray conditions in A and D based on hypergeometric probability. Asterisks in (B) indicate significant difference from E. coli OP50 (p-value < 0.01, based on Student's t-test). Error bars in B-C represent SEM of 3 independent biological replicates.