Figures & data
Figure 1. Characterization of EVs secreted by A. castellanii (A) Scanning microscopy of A. castellanii demonstrating the ultrastructure and topography of the amoeba. At the cell´s surface, it is possible to visualize the vesicle shedding, with evagination from the membrane of sphere-like structures. (B and C) Negative contrastation and diameter measurement of EVs secreted by A. castellanii isolated from (B) PYG (PYG-EVs, average diameter of 117.1 ± 73.3 nm as indicated by the axis thick and gray dashed line) and (C) glucose (glucose-EVs, average diameter of 117.7 ± 55.8 nm indicated by axis thick and gray dashed line) medium. On images (B and C), solid black arrows indicate the presence of nano-EVs (<50 nm); open arrows the presence of EVs ranging from 50–200 nm and white arrows, a population of large EVs (>200 nm). Displayed results are the average of 2 independent experiments.
Figure 2. Characterization of the EVs’ populations secreted by A. castellanii by dynamic light scattering (DLS). The graphs are representative of the two replicates displaying similar results. EVs secreted and isolated from A. castellanii grown in (A) PYG (PYG-EVs, total average of 287.7 ± 154.8 nm, black arrow and gray dashed line) and (B) glucose medium (glucose-EVs, total average of 365.1 ± 224.6 nm, black arrow and gray dashed line). (C and D) Correlation of the diameters obtained by electron microscopy and DLS of EVs isolated from A. castellanii grown in (C) PYG (PYG-EVs) and (D) glucose medium (glucose-EVs). Open circles (○) indicates EVs populations identified in only one of the size measurement methodology, whereas closed circles (•) indicates EVs populations identified in both methods.
Figure 3. Evaluation of neutral lipid composition of EVs. (A) High performance thin liquid chromatography for neutral lipids of the EVs from Acanthamoeba castellanii. Lane 1 – Lipid standards (TG- Triglycerides −; DAG- Diacylglycerol; MAG- Monoacylglycerol), Lane 2- EVs secreted in PYG, Lane 3- EVs secreted in glucose medium and Lane 4- Lipid standards (EC- Esterified cholesterol; FFA- Free fatty acids; S- cholesterol; PL/O- Phospholipids. (B) GC-MS for determination of sterol composition in EVs of A. castellanii. Two biological replicates were analyzed with similar results. Peaks of interest are represented by numerals, followed by their retention time in the chromatogram. Peak 1 – [(3-β)-cholest-5-en-3-yl]oxy]trimethyl]-silane (rt = 32.557 min), Peak 2 – [(ergosta-5,7,22-trien-3β-yloxi)trimethyl]-silane (rt = 35.355 min) and Peak 3 -stigmasta-5,7,22-trien-3α-ol (rt = 35.520 min). (C) GC-MS for fatty acids present in the EVs of A. castellanii. Peaks of interest are represented by numerals, followed by their retention time in the chromatograph. Peak 1- methyl miristate (rt = 20.663 min), Peak 2- methyl palmitate (rt = 32.008 min), Peak 3- methyl linoleate (rt = 44.200 min), Peak 4- methyl oleate (rt = 44.683 min), Peak 5- methyl stearate (rt = 46.675 min) of and Peak 6- methyl erucate (rt = 75.033 min).
![Figure 3. Evaluation of neutral lipid composition of EVs. (A) High performance thin liquid chromatography for neutral lipids of the EVs from Acanthamoeba castellanii. Lane 1 – Lipid standards (TG- Triglycerides −; DAG- Diacylglycerol; MAG- Monoacylglycerol), Lane 2- EVs secreted in PYG, Lane 3- EVs secreted in glucose medium and Lane 4- Lipid standards (EC- Esterified cholesterol; FFA- Free fatty acids; S- cholesterol; PL/O- Phospholipids. (B) GC-MS for determination of sterol composition in EVs of A. castellanii. Two biological replicates were analyzed with similar results. Peaks of interest are represented by numerals, followed by their retention time in the chromatogram. Peak 1 – [(3-β)-cholest-5-en-3-yl]oxy]trimethyl]-silane (rt = 32.557 min), Peak 2 – [(ergosta-5,7,22-trien-3β-yloxi)trimethyl]-silane (rt = 35.355 min) and Peak 3 -stigmasta-5,7,22-trien-3α-ol (rt = 35.520 min). (C) GC-MS for fatty acids present in the EVs of A. castellanii. Peaks of interest are represented by numerals, followed by their retention time in the chromatograph. Peak 1- methyl miristate (rt = 20.663 min), Peak 2- methyl palmitate (rt = 32.008 min), Peak 3- methyl linoleate (rt = 44.200 min), Peak 4- methyl oleate (rt = 44.683 min), Peak 5- methyl stearate (rt = 46.675 min) of and Peak 6- methyl erucate (rt = 75.033 min).](/cms/asset/3c33f1c1-9fc8-4592-ba51-5fa30aab22b7/kvir_a_1451184_f0003_b.gif)
Figure 4. Identification and grouping of proteins in the secretome of A. castellanii grown in PYG (A and B) and under stress condition (glucose medium, C and D). (A) Venn diagram of the PYG secretome, comparing PYG-EVs (110 proteins) and PYG-EVs-free supernatant (90 proteins, from Supplementary Figure 2 A and B, respectively). From the 179 unique proteins identified, PYG-EVs exclusive proteins (89; 49,7%) are shown in red; proteins identified only in the EVs-free supernatant (69; 38.5%) are shown in yellow, and common proteins of both fractions are shown in orange (21; 11.7%) (B) Number of proteins identified exclusively in PYG-EVs are shown as red bars, whereas the number of proteins only in the EVs-free supernatant are shown in yellow and the number of proteins found in both fractions are shown in orange. (C) Venn diagram of glucose medium secretome, comparing glucose-EVs (148 proteins) and PYG-EVs-free supernatant (71 proteins, from Supplementary Figure 2 C and D, respectively), totalizing 205 unique proteins identified under nutritional stress (glucose medium). The number of proteins identified exclusively in glucose-EVs are shown in blue (134; 65.4%); proteins identified only in the glucose-EVs-free supernatant are shown in gray (57; 27.8%), and common proteins of both fractions are shown in light blue (14; 6.8%). (D) Number of proteins identified from each specific class exclusively in glucose-EVs are shown as blue bars, whereas number of proteins identified only in the glucose-EVs-free supernatant are shown in gray and number of common proteins are shown in light blue. Proteins identified in EVs, EVs-free supernatant or commonly present in both fractions from either PYG or glucose medium, and the class they belonged, are discriminated in Supplementary Tables 1 and 2, respectively.
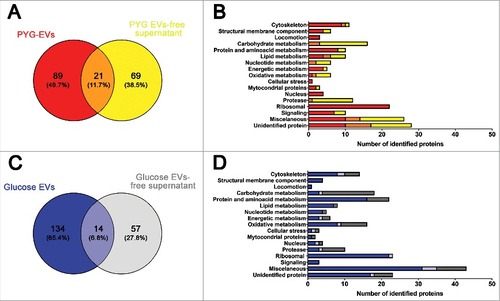
Figure 5. CHO epithelial cells internalization of EVs from A. castellanii. EVs were stained with DiI C18 (red-stained) and incubated with the CHO for different time points. CHO nuclei were stained with DAPI (blue) and the CtxB- Alexa 488 (green) was used to stain the GM1 ganglioside, a lipid raft marker located on the cell membrane. A. castellanii EVs (DiIC18 red labeled) co-localized with the lipid rafts, suggesting association of GM1 on the CHO internalization of EVs. At early time points, EVs can be found in association to the plasma membrane of CHO cells; at 1 h, EVs seem to be distributed or disseminated through the cytoplasm of CHO cells. Results are representative of at least 10 different fields.
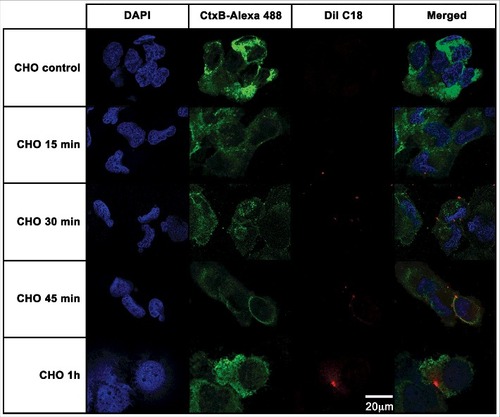
Figure 6. T98G glioblastoma cells internalization of EVs from A. castellanii. EVs were stained with DiI C18 (red-stained) and incubated with the CHO for different time points. T98G nuclei were stained with DAPI (blue) and the CtxB- Alexa 488 (green) was used to stain the GM1 ganglioside, a lipid raft marker located on the cell membrane. A. castellanii EVs co-localized with the lipid rafts, suggesting association of GM1 on the T98G internalization of EVs. At early time points, EVs are associated to the membrane of T98G cells; at 1 h, EVs seems to be randomly distributed through the cytoplasm of T98G cells. Results are representative of at least 10 different fields.
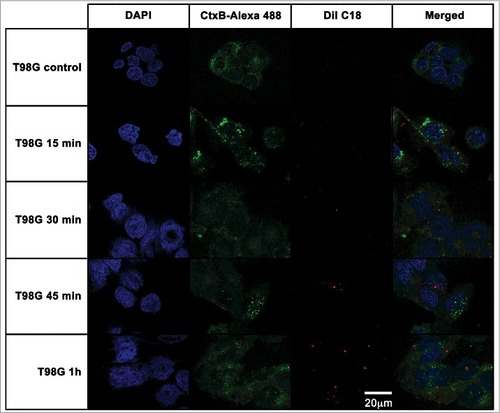
Figure 7. Effects of A. castellanii secretome on viability of mammalian cells. Cells were incubated with decreasing concentrations of A. castellanii secretome (from 20 to 0.010 µg/mL, expressed in total protein content). Cell viability was calculated by the ratio of absorbances of (treated cells)/(untreated negative control). (A-B) Cell viability of CHO cells determined by the MTT assay upon 6 h incubation with (A) EVs and (B) EVs-free supernatant (symbols and solid lines). (C-D) Cell viability of T98G cells determined upon 6 h incubation with (A) EVs and (B) EVs-free supernatant (symbols and dashed lines). PMSF- serine protease inhibitor, phenantroline – metalloprotease inhibitor, pepstatin A- aspartic protease inhibitor, E-64- cystein protease inhibitor and cocktail – complete mini-tabs (Sigma-Aldrich). #p < 0.05.
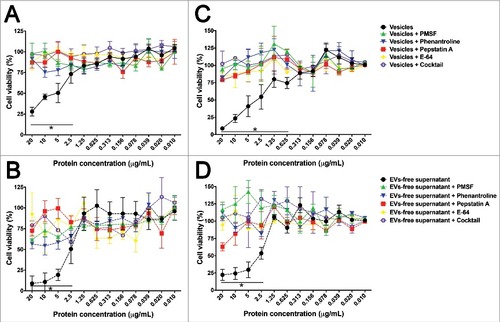
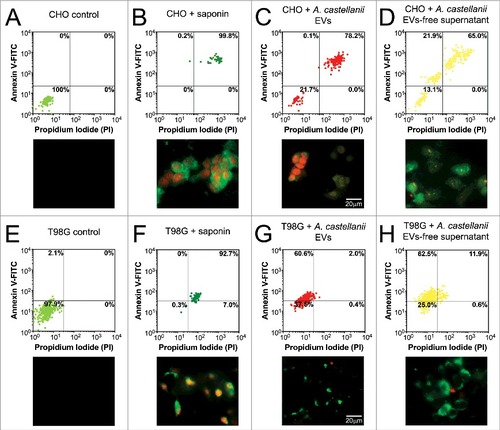
Figure 8. Evaluation of cell death upon treatment of CHO and T98G cells with EVs or EVs-free supernatant. Cells were stained with the Annexin V-FITC (green)/ PI (orange) kit, fluorescence images were recorded and the intensity of cell analyzed for each channel. (A-D) CHO evaluation upon treatment with A. castellanii EVs. (A) untreated CHO control, (B) saponin treated CHO, (C) EVs treated and (D) EVs-free supernatant treated CHO cells. (E-H) T98G treatment with A. castellanii EVs. (E) untreated T98G cells, (F) saponin treated T98G, (G) EVs treated and (H) EVs-free supernatant treated CHO cells. Pictures bellow each graph are representative of the microscopy images. Saponin treated CHO or T98G cells, and CHO treated with EVs or EVs-free supernatant displayed double positivity (PI+/Annexin V+), with strong stain of nuclei (orange) and phosphatidylserine on cell membrane (green), suggesting a necrotic process. T98G cells treated with EVs or EVs-free supernatant displayed a single stain (PI−/Annexin V+), suggesting apoptosis.