
Figures & data
Figure 1. TEM analysis shows intracellular P. gingivalis localizes to ER-perinuclear regions and is encapsulated by double-membrane vacuoles. (A) Transmission Electron Microscopy (TEM) analysis indicates internalized bacteria being closely positioned in the ER-rich regions at 15 minutes post P. gingivalis infection (MOI 100). ER structure(s) are outlined in a dotted black line while intracellular bacteria are identified by dotted red circles. (B) Ultrastructural analysis by thin-section electron microscopy show majority of P. gingivalis being enclosed by double membranous structures (characteristic of autophagosomes) at 6 hour post-infection. Primary GECs were infected with P. gingivalis at MOI 100 for 6 hours (top) and 24 hours (bottom). Boxed areas show an enlarged region. Black arrows indicate the double membrane surrounding the bacteria and red arrows indicate the P. gingivalis membrane.
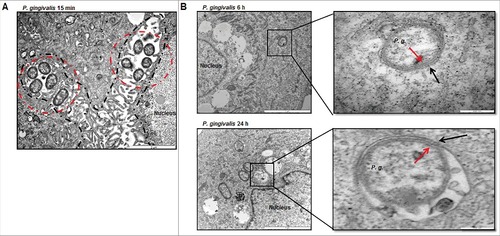
Figure 2. Three-dimensional (3D) TEM analysis shows double membrane-vacuoles in primary GECs harboring P. gingivalis contain multiple bacteria. At least 16 consecutive TEM sections were collected from cell samples infected with P. gingivalis for 12 hours at MOI 100 and micrographs of intracellular bacterial cells were captured. The 12 hour images were illustrated to highlight the presence of double-membrane replicative niches, appearing earlier than 24 hours post-infection (not shown) which also revealed similar results. Representative slices at stacks 5, 11, 15, and 16 are shown and the bacteria and phagosome are outlined using 3dmod software.
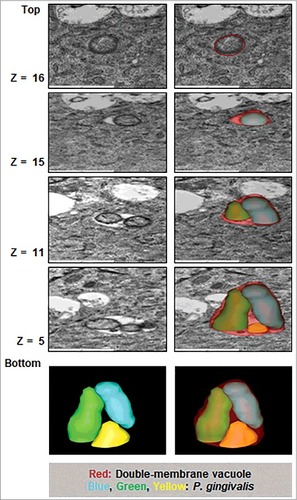
Figure 3. P. gingivalis vacuolar localization significantly increases over time of infection in primary GECs. Immunofluorescence intensity based quantification of cytoplasmic and vacuolar P. gingivalis at 3, 6, 12, and 24 hours post infection. (A) Primary GECs were infected with PgFbFP, green fluorescing P. gingivalis at MOI 100. Infected PgFbFP were labeled using anti-P. gingivalis antibody followed by Alexa 594 (red-fluorescence) secondary antibody after selective digitonin permeabilization (which will only permeabilize cellular plasma membrane). Cytoplasmic bacteria were detected as FbFP-and Alexa 594 positive (yellow), whereas vacuolar bacteria were solely FbFP-positive (green). 40x micrographs; Bar 10 µm. (B) The percentage of intracellular bacteria are represented as mean +/− SD; n > 3. p < 0.01 as determined by ANOVA. The slight decrease and increase in vacuolar and cytoplasmic bacteria, respectively, observed at 12 hours post-infection was not statistically significant compared to 6 hours post-infection (according to Student's two-tailed t-test).
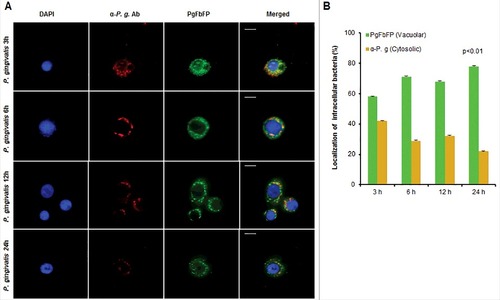
Figure 4. P. gingivalis significantly co-localizes with LC3 positive/ER regions in primary GECs. (A) Western blot analysis of LC3II lipidation of P. gingivalis-infected cells (MOI 100) over 0.5, 1, 3, 6, 12, and 24 hours of infection. Quantification was conducted using NIH ImageJ analysis; n≥3; p<0.05 as determined by ANOVA. (B) GFP-LC3 transfected GECs were infected with P. gingivalis 24 hours stained red (Alexa 594) and analyzed using confocal microscopy. Colocalization rate is ∼99%. 40x micrographs; Bar 10 µm. (C) P. gingivalis infected GECs, after 24 hours, were stained for LC3 (Alexa 594 or 488), ER lumen protein Bip (Alexa 594), and P. gingivalis (Alexa 488 or 350). High co-localization is observed through immunofluorescence imaging between P. gingivalis with LC3 and LC3 with Bip. 20x micrographs; Bar 10 µm. (D) Representative micrographs of 24 hour P. gingivalis infected cells (Alexa 488) and ER Tracker (red) analyzed through quantitative confocal microscopy. Quantitative analysis of 3, 6, 12, and 24 hours of infection demonstrate high, steady co-localization rate between P. gingivalis and the ER (co-localization ∼98%). 20x micrographs; Bar 10 µm.
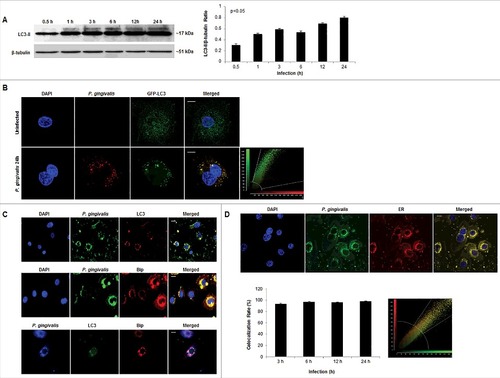
Figure 5. Inhibition of autophagy significantly decreases intracellular survival of P. gingivalis in primary GECs. Primary GECs were infected with P. gingivalis at an MOI 100 for 3, 6, 12, and 24 hours. P. gingivalis survival was determined using a standard antibiotic protection assay and quantified by colony forming units (CFU)/ml based on blood agar plate counts. Graphs are represented as mean +/ SEM, n≥3; p < 0.05 as determined by ANOVA. (A) GECs were pre-treated with 3-MA for 3 hours prior to P. gingivalis infection. (B) GECs were transfected with ATG5 siRNA or non-target siRNA 36 hours prior to P. gingivalis infection. Confirmation of ATG5 downregulation (>50%) is shown by Western blot analysis.
Figure 6. P. gingivalis' localization with LAMP1-positive structures in primary GECs. Quantitative confocal microscopic analysis of P. gingivalis MOI 100 (Alexa 488) colocalization with lysosomes using the lysosomal marker LAMP1 (Alexa 594) at different time points of infection; 6, 12, and 24 hours. Confocal image represents 24 hours of infection and shows only a small subset of bacteria co-localizing with lysosomes, which remains relatively similar throughout the course of infection. Quantification in the bar graph is shown as the mean +/− SD and graphed with the ER tracker colocalization rates from for comparison. 20x micrographs; Bar 10 µm.
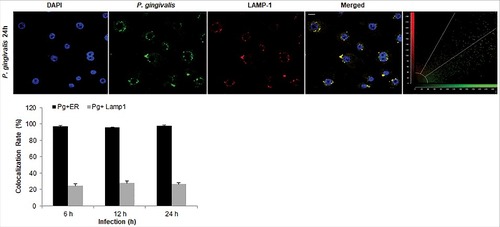
Figure 7. Fluorescence -microscopic analysis of co-localization between vacuolar- and cytosolic-P. gingivalis with NDP52 ubiquitin-binding-adaptor protein in primary GECs. (A) Primary GECs were infected with PgFbFP (green fluorescence) and after differential digitonin permeabilization stained with an anti-P. gingivalis antibody (Alexa 594, red fluorescence), followed by staining against NDP52 (Alexa 350, blue fluorescence). Cytoplasmic bacteria were detected as FbFP-and Alexa Fluor 594 positive (yellow) previously, whereas vacuolar bacteria were only FbFP-positive (green). 40x micrographs; Bar 10 µm. (B) Majority of cytosolic P. gingivalis was determined to show a significant association with NDP52 (red and blue = purple). Mean +/− SD, n>3.
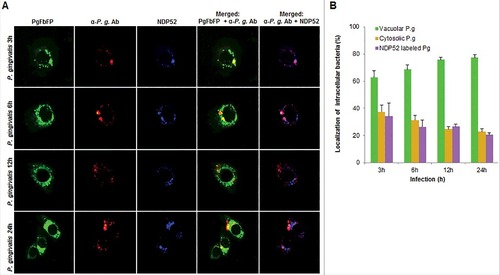
Figure 8. Fluorescence microscopic analysis of co-localization between vacuolar- and cytosolic-P. gingivalis with p62 ubiquitin-binding-adaptor protein in primary GECs. (A) Primary GECs were infected with PgFbFP (green fluorescence) and after differential digitonin permeabilization stained with an anti-P. gingivalis antibody (Alexa 594, red fluorescence), followed by staining against p62 antibody (Alexa 350, blue fluorescence). Cytoplasmic bacteria were detected as FbFP-and Alexa Fluor 594 positive (yellow) previously, whereas vacuolar bacteria were only FbFP-positive (green). 40x micrographs; Bar 10 µm. (B) Majority of cytosolic P. gingivalis was determined to show a significant association with p62 (red and blue = purple). Mean +/− SD, n > 3.
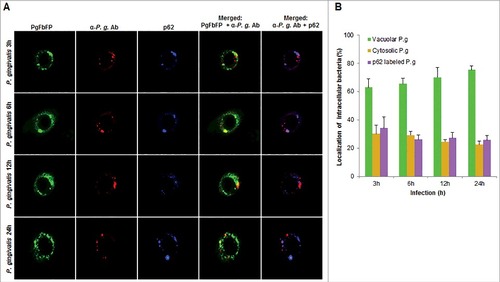
Figure 9. Proposed diagram of P. gingivalis trafficking/fate in human gingival epithelial cells. P. gingivalis invades primary GECs mainly through specific binding to Beta-1 integrins on the cell surface and the internalized bacteria are not found to be constrained by membrane-bound vacuoles [Citation10–13]. (A) Survival: After initial internalization, cytosolically-free P. gingivalis rapidly localizes to ER-rich regions and promotes LC3 lipidation and thus phagophore formation. Multiplying bacteria are found in these ER-rich autophagosomes, marked by LC3 and ER lumen protein BiP, suggestive of a replicative niche in which they are not eliminated. The depletion of ATG5 by siRNA results in significantly less survived intracellular P. gingivalis further indicating the importance of autophagy for bacterial life (B) Degradation: Only a small subset of P. gingivalis remains free in the cytosol. These cytosolic bacteria are targeted by anti-microbial ubiquitin adaptor proteins, NDP52 and p62, for degradation by the lysosome, also marked by LAMP1.
![Figure 9. Proposed diagram of P. gingivalis trafficking/fate in human gingival epithelial cells. P. gingivalis invades primary GECs mainly through specific binding to Beta-1 integrins on the cell surface and the internalized bacteria are not found to be constrained by membrane-bound vacuoles [Citation10–13]. (A) Survival: After initial internalization, cytosolically-free P. gingivalis rapidly localizes to ER-rich regions and promotes LC3 lipidation and thus phagophore formation. Multiplying bacteria are found in these ER-rich autophagosomes, marked by LC3 and ER lumen protein BiP, suggestive of a replicative niche in which they are not eliminated. The depletion of ATG5 by siRNA results in significantly less survived intracellular P. gingivalis further indicating the importance of autophagy for bacterial life (B) Degradation: Only a small subset of P. gingivalis remains free in the cytosol. These cytosolic bacteria are targeted by anti-microbial ubiquitin adaptor proteins, NDP52 and p62, for degradation by the lysosome, also marked by LAMP1.](/cms/asset/65edc147-04aa-4ab5-a592-fea9553aaeeb/kvir_a_1454171_f0009_oc.jpg)