
Figures & data
Figure 1. Collection and chemical analyses of Galleria mellonella. A: Haemolymph was collected by first puncturing the larvae behind the first set of thoracic (true) legs, in the inter-spiracle space, with a 0.5 mL BD fine insulin syringe. For each replicate, haemolymph from five larvae was collected. From 5 to 7 µL of pure haemolymph was collected from each larvae using a 10 µL capillary tube and was ejected into a 0.2 ml tube containing 50 µL of solvent (8:1:1 methanol:chloroform:water) to prevent melanization. Portions from the replicates were derivatized using TMS, MCF, or BF3 prior to the GC-MS analysis. B: GC-MS total ion chromatogram of G. mellonela haemolymph after TMS derivatization. The numbers above the peaks refer to the numbers listed in Is: internal standard used to calculate the absolute amount of each compounds.
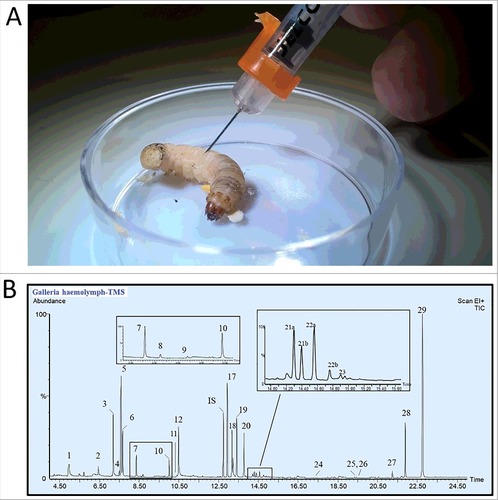
Table 1. Concentration (mM) of metabolites of Galleria mellonella haemolymph derivatized by trimethylsilylation (TMS) and analyzed by GC-MS. Means ± standard deviation shown were generated from total ion chromatograms (TIC) peaks from duplicate injections from five biological samples (n = 10). Peak areas were converted to mM concentration by use of linear calibration curves of standard reference compounds treated the same as samples.
Table 2. Concentration (mM) of metabolites of Galleria mellonella haemolymph derivatized by methyl chloroformate (MCF) and analyzed by GC-MS. Means ± standard deviation shown were generated from total ion chromatograms (TIC) peaks from duplicate injections from five biological samples (n = 10). Peak areas were converted to mM concentration by use of linear calibration curves of standard reference compounds treated the same as samples.