Figures & data
Figure 1. Resistance of V. vulnificus to HS. The initial bacterial population of the different V. vulnificus strains was considered “100” and survival at each time was calculated as a percentage. Bars indicate the standard deviation for three replicates. CECT, Spanish Type Culture Collection. Subspecific classification of the strains according to9: YJ016 and CECT5168 (or CDC-7184), formerly classified as Bt1, belong to Lineage 1, CECT529T (or ATCC27562, type strain of the species), formerly classified as Bt1, belongs to Lineage 2; CECT4999 and CECT5769, formerly classified as Bt2 belongs to Lineage 2 and pv piscis; 11028 and 12, formerly classified as Bt3, belongs to Lineage 3.
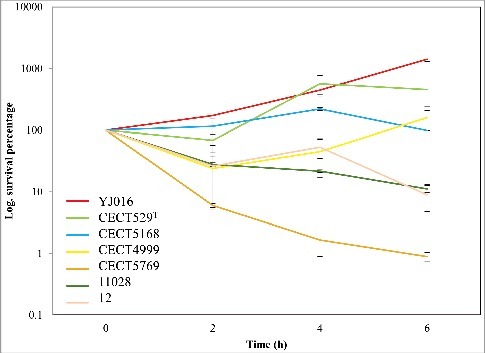
Figure 2. Characterization of the V. vulnificus transposon insertion library. Distribution of the percentage of TA sites disrupted per gene encoded on the large chromosome (A) and the small chromosome (B). Genes classified as underrepresented (U), regional (R), or neutral (N) are represented within each bin for each chromosome. (C) Status of genes homologous to a non-neutral V. vulnificus gene in V. cholerae, V. parahaemolyticus, and V. fischeri. U/R indicates underrepresented, regional, or comparably classified, homolog and N indicates neutral or comparably classified homolog.
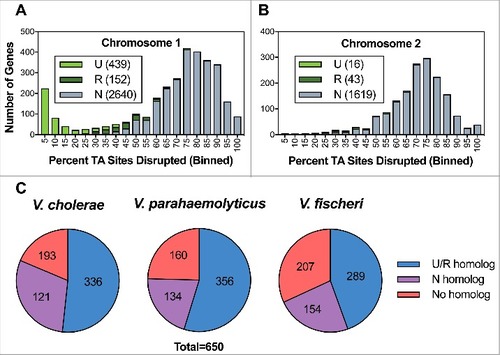
Figure 3. Identification of genes conditionally depleted in human serum (A and B) and characterization of mutants in selected genes (C y D). (A) Distribution of the percentage of TA sites disrupted per gene in the LB or HS-selected libraries. Genes classified as conditionally depleted (CD), queried (Q), or insufficient data (ID) are indicated in each bin. (B) Results of Con-ARTIST analysis. x-axis indicates change in relative abundance of insertion mutants per gene between LB and HS, and the y-axes indicates the concordance of independent insertion mutants within each gene. Genes exhibiting a greater than 4-fold change (Log2(mean fold change) <- 2 or > 2) across multiple mutants (mean inverse P-value > 102) are considered conditionally depleted and are shown in red. Large red squares indicate wza and wzc, which are known to be attenuated in HS. (C) Survival percentage of YJ016, the deletion mutants and its complemented strains after 2 and 4 h incubated in human serum. (D) CPS detection by immunostaining. Bacteria were grown in LB (1% NaCl), associated-cell polysaccharides were extracted, separated by SDS-PAGE, transferred to NC-sheets and immunostained with specific antibodies against YJ016.
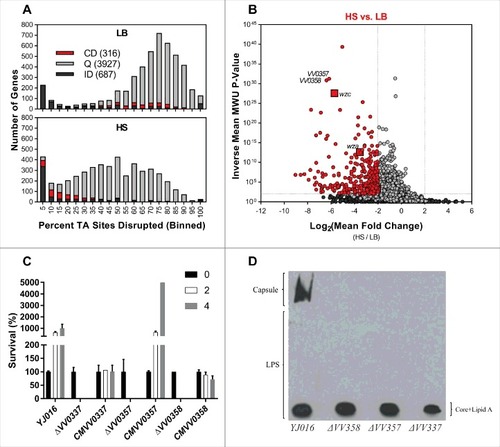
Table 1. Virulence assays on iron-overloaded BALB/C mice.
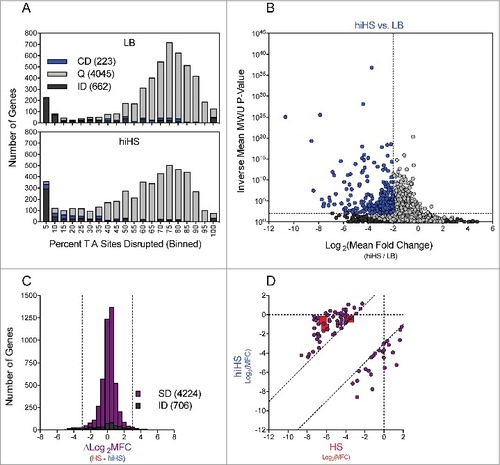
Figure 4. Identification of genes conditionally depleted in heat inactivated human serum. (A) Distribution of the percentage of TA sites disrupted per gene in the LB or hiHS-selected libraries. Genes classified as conditionally depleted (CD), queried (Q), or insufficient data (ID) are indicated in each bin. (B) Results of Con-ARTIST analysis. x-axis indicates change in relative abundance of insertion mutants per gene between LB and HS, and the y-axes indicates the concordance of independent insertion mutants within each gene. Genes exhibiting a greater than 4-fold change (Log2(mean fold change) <- 2 or > 2) across multiple mutants (mean inverse P-value > 102) are considered conditionally depleted. (C) The difference in Log2(Mean Fold Change) (HS – hiHS) was plotted for SD (sufficient data: 5+ informative sites in both comparisons) and ID (insufficient data: <5 informative sites in one or more comparisons) genes. (D) Log2(Mean Fold Change Values) from the HS and hiHS samples are plotted on the x- and y-axes, respectively, for genes with >8-fold difference between the two selections. Large red squares indicate wza, VV0357, and VV0358, which were conditionally depleted in HS but not in hiHS.