
Figures & data
Table 1. Antimicrobial susceptibility test of the hypervirulent K. pneumoniae RJA166, RJF293 and pRJA166a/RJF293H transconjugants.
Figure 1. Effect of ceftazidime and imipenem on K. pneumoniae RJA166 infection in murine model. (a) The survival curve of the BALB/c mice infected with 1.8 × 10³ CFU of Klebsiella pneumoniae RJA166 with different treatments. In the 14 days after bacteria challenge, mice treated by imipenem (20 mg/kg), ceftazidime (40 mg/kg) and saline (0.9%) showed mortalities of 30%, 70% and 100%, respectively. (b) The bacterial load of murine tissues in the mice treated with different antibiotic. The results were calculated by dividing the quantity of bacterial gyrase gene by the quantity of murine β-actin gene. The bacterial loads in the kidneys, spleens and livers from the mice treated with ceftazidime were significantly higher than those in the mice treated with imipenem, with the p value 0.0383, <0.0001 and <0.0001, respectively, as generated by Student's t test.
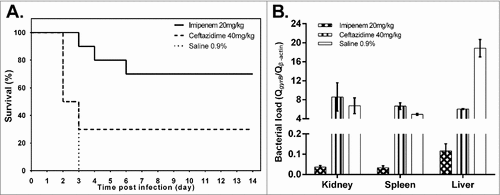
Figure 2. The genetic context of the blaDHA-1 gene in the resistance plasmid pRJA166a of K. pneumoniae RJA166. The plasmid shares the backbone of two previously reported plasmids pYNKP001-dfrA of Raoultella ornithinolytica YNKP001[ref. Citation22] and pKOX_R1 of Klebsiella michiganensis E718 [ref. Citation23]. The predicted antibiotic resistance gene is shown in red, the tra gene cluster is in dark green, and the IS element is shown in light green.
![Figure 2. The genetic context of the blaDHA-1 gene in the resistance plasmid pRJA166a of K. pneumoniae RJA166. The plasmid shares the backbone of two previously reported plasmids pYNKP001-dfrA of Raoultella ornithinolytica YNKP001[ref. Citation22] and pKOX_R1 of Klebsiella michiganensis E718 [ref. Citation23]. The predicted antibiotic resistance gene is shown in red, the tra gene cluster is in dark green, and the IS element is shown in light green.](/cms/asset/5b70583a-0bfb-40ce-b86e-b6ddd9767b33/kvir_a_1456229_f0002_oc.jpg)
Figure 3. Organizational map of the 26-kb accessory resistance region (RJA_27650…RJA_27825) on pRJA166a. Two other blaDHA-1-carrying plasmids with the same incompatibility group (IncHI5), pKP048 and pYNKP001-dfrA, were compared. The three modules (I–III) referred to in the text are shown as red boxes while the module that contains the conserved blaDHA-1 context is highlighted in the black boxes with dashed borders. The protein-coding regions are shown as arrows with different colours, where green indicates an IS element, black indicates integrase gene, red indicates antibiotic resistance gene and grey indicates flanking gene. Genes identical to the 3′-CS of class 1 integron are shown with an orange background. Inverted repeats of IS elements are represented as small black triangle above the arrow. VR1 and VR2 are the variable regions of In469, as defined by Liang et al [Citation22].
![Figure 3. Organizational map of the 26-kb accessory resistance region (RJA_27650…RJA_27825) on pRJA166a. Two other blaDHA-1-carrying plasmids with the same incompatibility group (IncHI5), pKP048 and pYNKP001-dfrA, were compared. The three modules (I–III) referred to in the text are shown as red boxes while the module that contains the conserved blaDHA-1 context is highlighted in the black boxes with dashed borders. The protein-coding regions are shown as arrows with different colours, where green indicates an IS element, black indicates integrase gene, red indicates antibiotic resistance gene and grey indicates flanking gene. Genes identical to the 3′-CS of class 1 integron are shown with an orange background. Inverted repeats of IS elements are represented as small black triangle above the arrow. VR1 and VR2 are the variable regions of In469, as defined by Liang et al [Citation22].](/cms/asset/c40b8023-2e1d-4423-9371-72f1af429216/kvir_a_1456229_f0003_oc.jpg)