
Figures & data
Table 1. Colistin MIC values and endotoxin levels of strains used in this study.
Figure 1. In vitro growth of LPS-deficient A. baumannii. Graphs represent the growth of ATCC 19606, IB004 and IB004 + pWH1266-lpxA in Mueller Hinton broth (A) and human serum (B). Data points represent the average of three independent cultures with error bars representing the standard deviation.
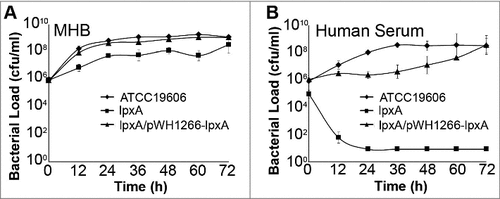
Figure 2. Growth and dissemination of LPS-deficient A. baumannii in an experimental mouse model. Tissue bacterial loads of ATCC 19606, IB004 and IB004 + pWH1266-lpxA in spleen, lungs and kidneys of mice infected with 2.5 × 10⁵ CFU of each strain (n = 4 mice/timepoint). Data points represent the average independent mice with error bars representing the standard deviation.
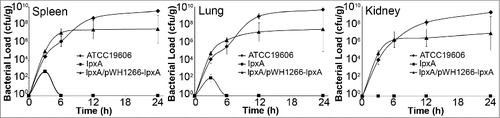
Figure 3. Fitness of LPS-deficient A. baumannii with its wild type counterpart in laboratory medium, human serum and mouse tissue. Competition indices comparing ATCC 19606 and IB004, and ATCC 19606 and IB004 + pWH1266-lpxA in Muller Hinton broth, human serum and mouse spleen. Bars represent the average of three independent assays with error bars representing the standard deviation.
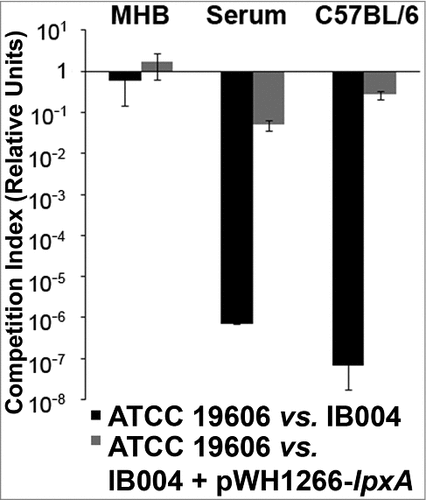
Figure 4. Serum cytokine levels after infection with LPS-deficient A. baumannii in a mouse model of experimental infection. Serum TNF-α (A) and IL-6 (B) levels in uninfected, ATCC 19606 infected, IB004-infected and IB004 + pWH1266-lpxA-infected mice (n = 6 mice/group) 12 hours after infection with 2.5 × 10⁵ CFU of the indicated strain. Bars represent average values and error bars represent the standard deviation. #P < 0.01 compared to uninfected mice, † P < 0.01 compared to IB004-infected mice; Tukey post-hoc test.
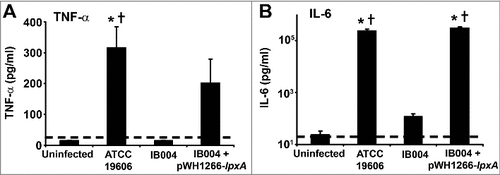
Figure 5. Virulence of LPS-deficient A. baumannii in a mouse model of disseminated infection. Survival of mice infected with 2.5 × 10⁵ CFU the indicated strains in a disseminated sepsis model during 7 days post-infection. #P < 0.005, log-rank test compared to ATCC 19606 and IB004 + pWH1266-lpxA infected mice.
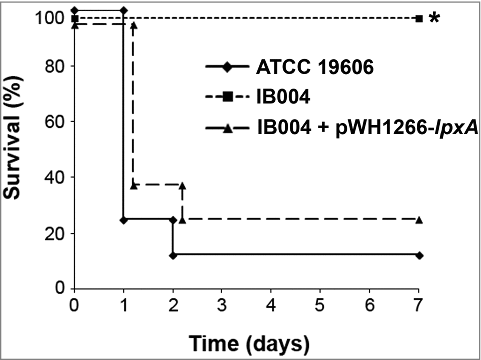
Figure 6. Effect of LPS loss on growth rate and biofilm production. Growth rate (A) and biofilm production (B) were determined for ATCC 19606, IB004, and IB004 + pWH1266-lpxA (IB004 C), and 5 pairs of multidrug resistant clinical isolates (Ab-84, Ab-108, Ab-167, Ab-178 and Ab-208) and their LPS-deficient derivatives (Ab-84R, Ab-108R, Ab-167R, Ab-178R and Ab-208R) and CS01/CR17. Bars represent the average of three separate assays, with error bars representing the standard deviation. #P < 0.005 compared to parental, LPS-replete strain, Student's t test. # P < 0.005 compared to complemented strain, Student's t test.
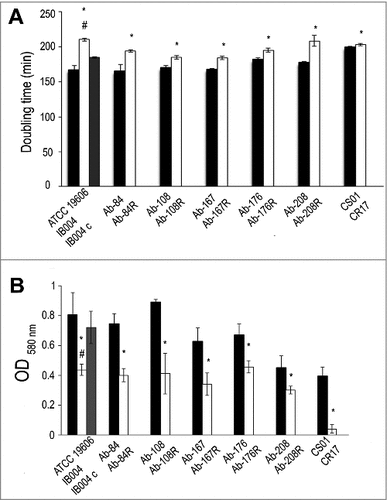
Figure 7. Effect of LPS loss on surface motility. Surface motility on semisolid media of ATCC 19606, IB004, and IB004 + pWH1266-lpxA, and 5 pairs of multidrug resistant clinical isolates (Ab-84, Ab-108, Ab-167, Ab-178 and Ab-208) and their LPS-deficient derivatives (Ab-84R, Ab-108R, Ab-167R, Ab-178R and Ab-208R) and CS01/CR17 after 72 hours of incubation. Bars represent the average of three separate assays, with error bars representing the standard deviation. #P < 0.005 compared to parental, LPS-replete strain, Student's t test. # P < 0.005 compared to complemented strain, Student's t test (A). Surface motility of the Ab-176 strain and its LPS-deficient counterpart after 72 hours of incubation (B).
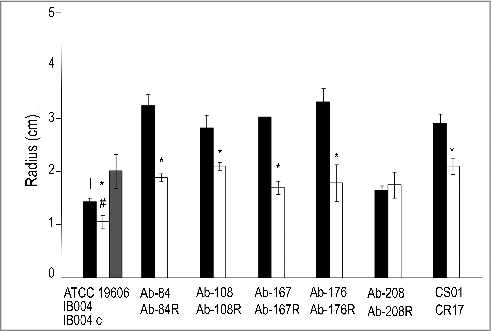
Figure 8. Effect of LPS loss on growth under iron limitation. Growth in iron limiting conditions of ATCC 19606, IB004, and IB004 + pWH1266-lpxA, and 5 pairs of multidrug resistant clinical isolates (Ab-84, Ab-108, Ab-167, Ab-178 and Ab-208) and their LPS-deficient derivatives (Ab-84R, Ab-108R, Ab-167R, Ab-178R and Ab-208R) and CS01/CR17 over 24 hours. Bars represent the average of three separate cultures, with error bars representing the standard deviation.
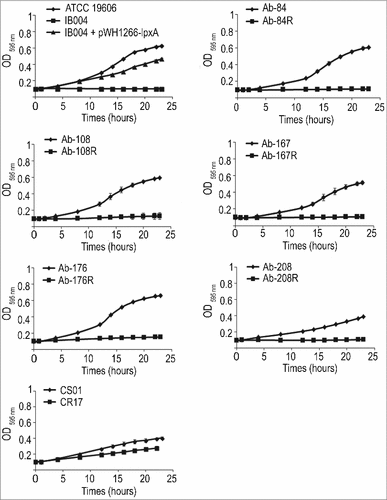
Table 2. Susceptibility (MIC) of A. baumannii strains to disinfectants.