Figures & data
Figure 1. Spatial distribution of MUC5AC and H. suis in porcine gastric specimens. A. Porcine gastric tissue fixed with Carnoy´s fixative to retain the mucus layer was stained with a fluorescently labelled antibody against MUC5AC (blue), demonstrating a thick mucus layer above the epithelium. Nuclei and cytoplasm were stained with HCS CellMask™ (red). B. Negative control for MUC5AC staining (i.e. no MUC5AC antibody was added) with nuclei and cytoplasm outlined with HCS CellMask™ (red). C, D, E. Fluorescent in situ hybridization using an H. suis specific probe on H. suis –free (C) and infected (D, E) porcine gastric tissue sections. In these images, mucus is not visible, but the tissue is outlined by dull green auto fluorescence. H. suis (bright green color) was detected in the mucus layer in the gastric pits (D). Of the H. suis present in the tissue, most were found in the lamina propria and/or associated with the (fried egg shaped) parietal cells (E).
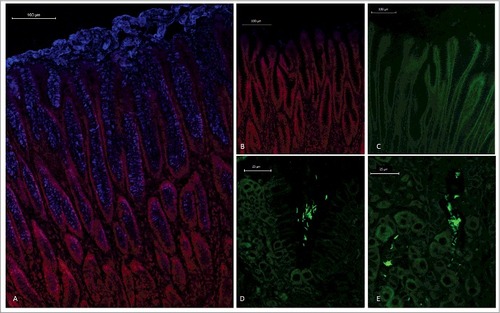
Figure 2. Isolation, solubility and density of porcine gastric mucins. A. Each specimen was separated into four types of mucin samples based on their tissue location and solubility in GuHCl. Mucins were then isolated from these samples using two steps of isopycnic CsCl density-gradient centrifugation. B. Fractions from the first density-gradient centrifugation (4 M GuHCl/1.39 g/mL) were analyzed for carbohydrate (▴), MUC5AC (▪), and DNA (─). The vertical dashed lines indicate how the mucin containing fractions were pooled for further purification in the second density-gradient centrifugation. C. Fractions from the second density-gradient centrifugation (0.5 M GuHCl/1.50 g/mL) were analyzed for carbohydrate (▴), MUC5AC (▪), and DNA (─). The vertical dashed lines indicate how the mucin containing fractions were pooled for further experiments. D. The density of the pig gastric mucins ranged from 1.38 to 1.47 g/mL. E. The proportion of mucins that were insoluble in GuHCl, was higher than the soluble (Mann-Whitney U-test: p ≤ 0.05). Abbreviations: SS: surface soluble, SI: surface insoluble, GS: gland soluble, GI: gland insoluble.
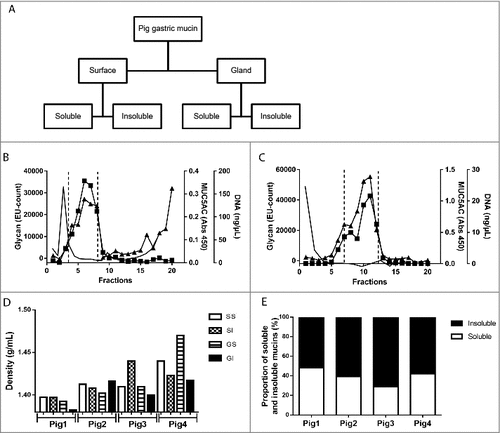
Figure 3. Effect of pH and mucin type on H. suis binding to pig gastric mucins. A. pH dependence of H. suis binding to mucins. Results are shown as mean ± SEM of bacterial binding after subtraction of background signal at each pH. ## and ### indicate p ≤ 0.01 and 0.001, respectively, in an unpaired two sided t-test comparing the binding to the negative control background at each pH. This assay was performed on four mucin samples, with similar results, ranging between the pronounced pH dependence shown with mucin 1 to the flatter curve seen with mucin 2. B. Effect of mucin type (surface (•), gland (○), soluble and insoluble) on H. suis binding at pH 2. Results are expressed as medians with interquartile ranges. ## indicates p ≤ 0.01 (Mann-Whitney U-test).
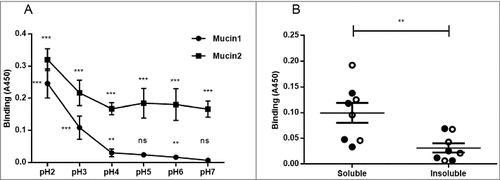
Figure 4. H. suis binding to pig and human gastric mucins. A, B, C. H. suis strains HS1 and HS5 binding to pig mucin groups (SS – surface soluble, SI – surface insoluble, GS – gland soluble, GI – gland insoluble) isolated from the stomach of four pigs (P1-4). D, E, F. Binding of H. suis strains HS1 and HS5 to human gastric mucins isolated from five human patients (H1-H5). G, H, I. Binding of H. pylori strain J99 wild type and its isogenic ΔbabA/ΔsabA deletion mutant to human gastric mucins. Results are shown as mean ± SEM of bacterial binding after subtraction of background signal at each pH. #, ## and ### indicate p ≤ 0.05, 0.01 and 0.001, respectively, One Way ANOVA, Dunnett´s post hoc test.
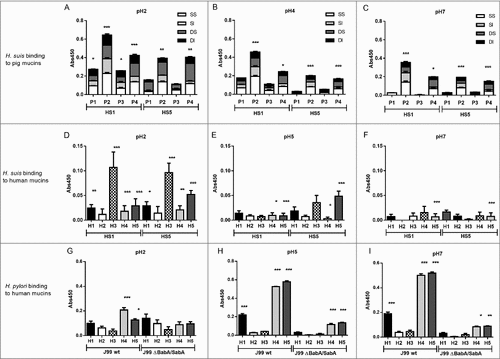
Figure 5. Comparison of binding of four H. suis strains to pig and human gastric mucins. H. suis binding at pH 2 (A), pH 4 (B) and pH 7 (C) to a human mucin, a pig mucin with high H. suis binding ability and a pig mucin with low H. suis binding ability.
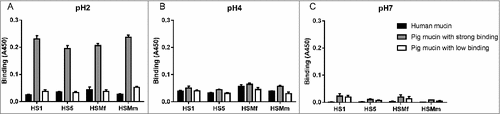
Figure 6. Porcine and human mucin O-glycosylation. A. Relative abundance of pig and human structures containing core 1–4 and sialyl-Tn. B. Size distribution (number of carbohydrate residues/glycan) of pig and human mucin O-glycans. C. Relative abundance of terminal glycan residues and sulfation on pig (n = 3, 12 subfractions) and human (n = 5) mucin glycans. Stars indicate statistically significant difference between pig and human mucin glycans, #, ## and ### indicate p ≤ 0.05, 0.01 and 0.001, respectively, Two-way ANOVA. D. Scatter plot of the amplitude of H. suis binding to mucins at pH 2 against their relative abundance of acidic glycan structures among pig (mainly sulfated structures, black) and human (mainly sialylated structures, grey). The r in the figures denotes the Pearson correlation coefficient, pooled for the human and pig data (pig mucins only: r = 0.85, human samples alone are too few to perform correlation analysis on).
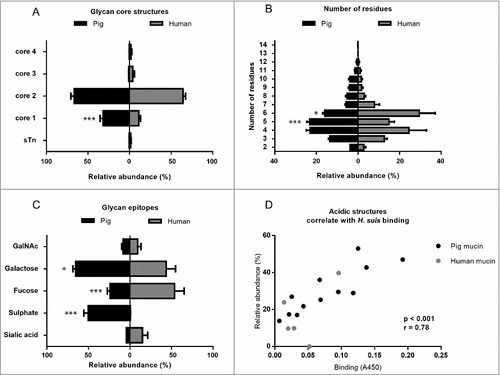
Table 1. Relative abundance of human mucin glycan structures that correlated with H. suis binding in pig mucins (). Abundance of human mucin glycan motifs implicated to potentially be of relevance to H. suis binding from the statistical correlations between binding and relative abundance on pig mucins (). Although the number of samples was too low to perform correlation studies, sialylated and sulfated structures terminating in Gal and overall sialylated and sulfated structures were highest in sample H3, coinciding with that this sample had the highest H. suis binding ability ().
Table 2. Porcine mucin glycan structures whose relative abundance correlate with the amplitude of H. suis binding to the mucins at pH 2 (A) or pH 7 (B). The two structures that had statistical correlation (p < 0.05) at both pH 2 and pH 7 are indicated with #. There were no positive statistical associations with the remainder of the identified glycan structures (listed in supplementary table S1).
Figure 7. Scatter plots between H. suis adhesion and the relative abundance of the two structures that were associated with binding at both pH 2 and 7. The r in the figures denotes the Pearson correlation coefficient.
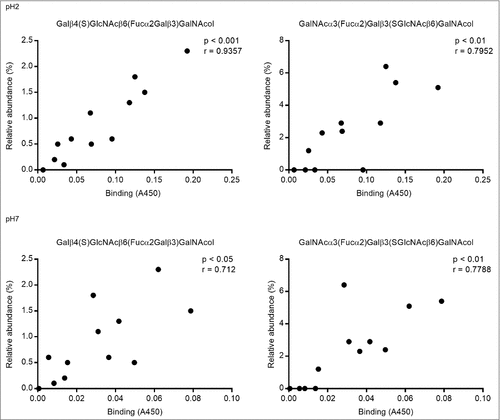
Figure 8. Identification of the m/z 975.25 structure (Galβ4(6S)GlcNAcβ6(Fucα2Galβ3)GalNAcol) from porcine gastric mucin O-glycans by LC-MS/MS. A. Extracted ion chromatogram (EIC) of m/z 975.25 [M-H]− B. Collision-induced dissociation (CID)-based MS/MS fragmentation spectra with annotated fragments C. Higher-energy collisional dissociation (HCD)-based MS/MS low mass region (m/z 110–390) showing fragments specific for blood group H on C3 arm and a type 2 LacNAc on C6 with 6-linked sulfate on GlcNAc. # denotes background ions. The Consortium for Functional Glycomics cartoons were used to represent O-linked glycan structures.
![Figure 8. Identification of the m/z 975.25 structure (Galβ4(6S)GlcNAcβ6(Fucα2Galβ3)GalNAcol) from porcine gastric mucin O-glycans by LC-MS/MS. A. Extracted ion chromatogram (EIC) of m/z 975.25 [M-H]− B. Collision-induced dissociation (CID)-based MS/MS fragmentation spectra with annotated fragments C. Higher-energy collisional dissociation (HCD)-based MS/MS low mass region (m/z 110–390) showing fragments specific for blood group H on C3 arm and a type 2 LacNAc on C6 with 6-linked sulfate on GlcNAc. # denotes background ions. The Consortium for Functional Glycomics cartoons were used to represent O-linked glycan structures.](/cms/asset/039e0748-cdf2-472f-b409-c15b1b711cb0/kvir_a_1460979_f0008_b.gif)
Figure 9. Characterization of H. suis binding glycosphingolipids from pig stomach. A. Thin-layer chromatogram after detection with anisaldehyde B. Autoradiogram obtained by binding of 35S-labeled H. suis (HS5) at pH 7.2. C. Autoradiogram obtained by binding of 35S-labeled H. pylori strain J99 wt at pH 7.2. The glycosphingolipids were separated on aluminum-backed silica gel plates, using chloroform/methanol/water 60:35:8 (by volume) as solvent system. Lanes 1–4 were total non-acid glycosphingolipids isolated from the stomach of four individual pigs, 40 µg/lane. D-G. LC-ESI/MS of the oligosaccharides obtained by digestion of the non-acid glycosphingolipid fraction of pig stomach (shown in chart A, lane 2) with Rhodococcus endoglycoceramidase II. D. Base peak chromatogram from LC-ESI/MS of the oligosaccharides derived from the non-acid glycosphingolipid fraction of pig stomach. E. MS2 spectrum of the ion at m/z 706 (retention time 14.2 min). F. MS2 spectrum of the ion at m/z 706 (retention time 18.3 min). G. MS2 spectrum of the ion at m/z 706 (retention time 18.5 min). H. Interpretation formulas showing the deduced oligosaccharide structures. Gb3, Galα4Galβ4Glc; Gb4, GalNAcβ3Galα4Galβ4Glc; A6-1, GalNAcα3(Fucα2)Galβ3GlcNAcβ3Galβ4Glc; Ley-6, Fucα2Galβ4(Fucα3)GlcNAcβ3Galβ4Glc; H5-1, Fucα2Galβ3GlcNAcβ3Galβ4Glc; L4, Galβ3GlcNAcβ3Galβ4Glc; nL4, Galβ4GlcNAcβ3Galβ4Glc; H5-2, Fucα2Galβ4GlcNAcβ3Galβ4Glc; Galα3-nLc4, Galα3Galβ4GlcNAcβ3Galβ4Glc; x2, GalNAcβ3Galβ4GlcNAcβ3Galβ4Glc; Galα3-nLc4, Galα3Galβ4GlcNAcβ3Galβ4GlcNAcβ3Galβ4Glc; GbA, GalNAcα3(Fucα2Galβ3GalNAcβ3Galα4Galβ4Glc.
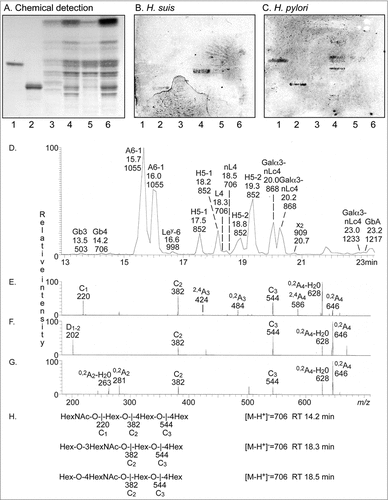
Figure 10. H. suis binding to synthetic glycoconjugates and inhibition of H. suis mucin binding. A. H. suis (HS1) binding to pig gastric mucin, LNT, LNnT, Leb, Slex (glycans conjugated to HSA) and DNA at pH 7. B. H. suis binding to pig gastric mucin, LNT conjugated to HSA and DNA (used as a marker for acidic charge without structural resemblance of mucins) at pH 2. C. Binding of H. suis to mucins was inhibited by pre-treatment of the bacteria with LNT and LSTa. To confirm the specificity of the inhibition, the experiment was also performed with monosaccharides that are part of the structures that inhibited binding (glucose, galactose, N-acetyl-glucosamine) and also with unrelated monosaccharides (fucose, N-acetyl-galactosamine). None of these structures interfered with the binding of the bacteria to the mucin (data not shown). Data are shown after subtracting background control for each pH. # indicates p ≤ 0.05, ## p ≤ 0.01 and ### p ≤ 0.001, One-way ANOVA, Dunnett´s post hoc test.
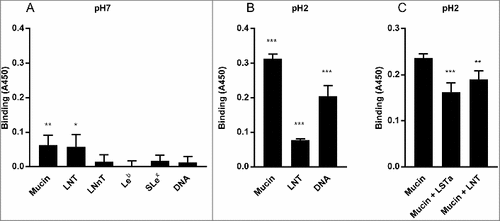
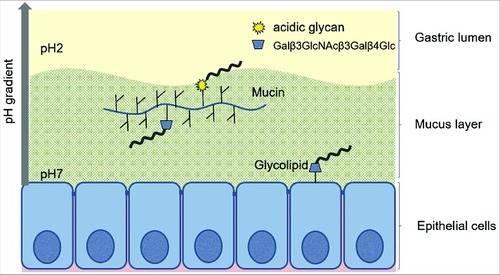
Figure 11. Schematic representation of the two binding modes of H. suis. H. suis binds to Galβ3GlcNAcβ3Galβ4Glcβ1 at both neutral and acidic pH and to negatively charged glycan structures at acidic pH. Galβ3GlcNAcβ3Galβ4Glcβ1 is present both on glycolipids at the epithelial surface where pH is close to neutral and on secreted mucins in the mucus layer where pH range from neutral to acidic, and H. suis binding can thus occur to this structure both when present on glycolipids and on mucins. H. suis binding to negatively charged glycan structures at acidic pH is likely to mainly occur to mucin glycans and shed DNA at a distance from the epithelial surface where the pH is acidic. Potentially binding to these structures could also occur after tissue invasion, i.e. at neutral pH when H. suis is present in the lamina propria and at acidic pH inside parietal cell canaliculi, however, the distribution of these structures in lamina propria and parietal cells is unknown.