2,318
Views
25
CrossRef citations to date
0
Altmetric
Research Paper

Regulation of hemolysin in uropathogenic Escherichia coli fine-tunes killing of human macrophages

ORCID Icon, ORCID Icon, , , , , ORCID Icon & ORCID Icon show all
Pages 967-980 | Received 07 Nov 2017, Accepted 12 Apr 2018, Published online: 30 May 2018

Figures & data

Figure 1. Screening of a transposon mutant library for mutants with a reduced capacity to kill human macrophages. (A) HMDM were treated with 50 μL of CFT073 TM mutant cultures (grown overnight) from individual Tn5 mutant clones, as well as the parental CFT073 TM strain. MTT assays, as a correlate of cell viability, were performed at 4 h post infection (pi), and a dot plot of HMDM viability after treatment with individual CFT073 TM Tn5 mutants is shown. Each data point represents A570 nm, relative to the parental CFT073 TM strain that was included in each plate, in order to correct for plate-to-plate variation across the screen. The eight mutants above the arbitrary threshold (2.75 fold or greater MTT value than that of the parental CFT073 TM strain for that plate) are displayed as open boxes. (B-C) BMM (B) or HMDM (C) were infected with either wild type CFT073 (filled bars) or the CFT073 TM (unfilled bars) over an MOI range (1, 3, 10 and 30), as indicated. Cell death was analyzed at 24 h pi by LDH release assays. Data (mean+sem; n = 5) are combined from five independent experiments, and each experiment was performed in experimental triplicate. Statistical significance was determined by a two-tailed t-test (#p < 0.05). ns = not significantly different.
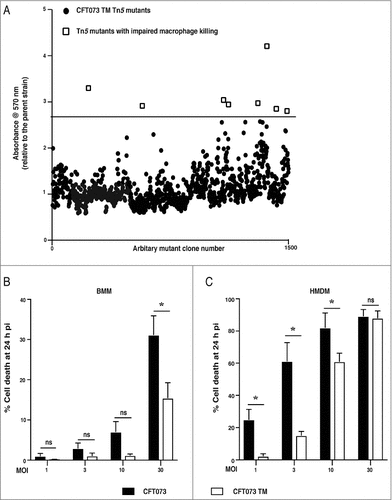
Figure 1. Screening of a transposon mutant library for mutants with a reduced capacity to kill human macrophages. (A) HMDM were treated with 50 μL of CFT073 TM mutant cultures (grown overnight) from individual Tn5 mutant clones, as well as the parental CFT073 TM strain. MTT assays, as a correlate of cell viability, were performed at 4 h post infection (pi), and a dot plot of HMDM viability after treatment with individual CFT073 TM Tn5 mutants is shown. Each data point represents A570 nm, relative to the parental CFT073 TM strain that was included in each plate, in order to correct for plate-to-plate variation across the screen. The eight mutants above the arbitrary threshold (2.75 fold or greater MTT value than that of the parental CFT073 TM strain for that plate) are displayed as open boxes. (B-C) BMM (B) or HMDM (C) were infected with either wild type CFT073 (filled bars) or the CFT073 TM (unfilled bars) over an MOI range (1, 3, 10 and 30), as indicated. Cell death was analyzed at 24 h pi by LDH release assays. Data (mean+sem; n = 5) are combined from five independent experiments, and each experiment was performed in experimental triplicate. Statistical significance was determined by a two-tailed t-test (#p < 0.05). ns = not significantly different.

Figure 2. Hemolysin is required for CFT073-mediated cell death and IL-1β release in human macrophages. HMDM were left untreated (A-B) or primed with LPS (100 ng/ml) for 4 h (C), prior to infection with the indicated UPEC strains over an MOI range. (A-B) Culture supernatants were collected at the indicated time points, and analyzed for LDH release as an indicator of cell death. (C) Culture supernatants (2 h pi) were analyzed for IL-1β release by ELISA. Data (mean+sem; n = 4) are combined from four independent experiments, and each experiment was performed in experimental triplicate. Statistical significance was determined by one-way ANOVA, followed by a Dunnett's test for multiple comparison (#p < 0.05, ##p<0.01, ####p < 0.0001). ns = not significantly different. (D) HMDM were left untreated or were primed with LPS (100 ng/ml) for 4 h, then pre-treated with the NLRP3-specific inhibitor, MCC950 for 1 h prior to infection with the indicated UPEC strains (MOI 10). Cell lysates and supernatants were collected at 2 h pi, and were analyzed by western blot for pro- and cleaved IL-1β. Glyceraldehyde 3-phosphate dehydrogenase (GAPDH) was used as a loading control and as an additional read-out for cell death (release into cell culture supernatants). Similar results were apparent in two independent experiments. (E-F) HMDM were left untreated (E) or primed with LPS (100 ng/ml) for 4 h (F), prior to infection with the indicated UPEC strains (WT denotes wild type, pSU2718 is the empty vector control, pHlyCABD is a plasmid expressing the entire hemolysin operon) at MOI 10. (E) Culture supernatants were collected at 2 h pi and analyzed for LDH release. (F) Culture supernatants (2 h pi) were analyzed for IL-1β release by ELISA. Data is from single experiment performed in experimental triplicate (mean+range), and similar observations were made in three independent experiments.
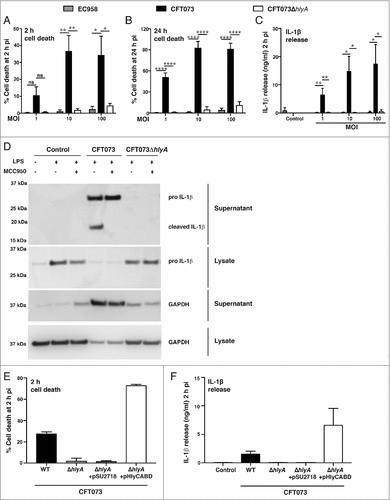
Figure 2. Hemolysin is required for CFT073-mediated cell death and IL-1β release in human macrophages. HMDM were left untreated (A-B) or primed with LPS (100 ng/ml) for 4 h (C), prior to infection with the indicated UPEC strains over an MOI range. (A-B) Culture supernatants were collected at the indicated time points, and analyzed for LDH release as an indicator of cell death. (C) Culture supernatants (2 h pi) were analyzed for IL-1β release by ELISA. Data (mean+sem; n = 4) are combined from four independent experiments, and each experiment was performed in experimental triplicate. Statistical significance was determined by one-way ANOVA, followed by a Dunnett's test for multiple comparison (#p < 0.05, ##p<0.01, ####p < 0.0001). ns = not significantly different. (D) HMDM were left untreated or were primed with LPS (100 ng/ml) for 4 h, then pre-treated with the NLRP3-specific inhibitor, MCC950 for 1 h prior to infection with the indicated UPEC strains (MOI 10). Cell lysates and supernatants were collected at 2 h pi, and were analyzed by western blot for pro- and cleaved IL-1β. Glyceraldehyde 3-phosphate dehydrogenase (GAPDH) was used as a loading control and as an additional read-out for cell death (release into cell culture supernatants). Similar results were apparent in two independent experiments. (E-F) HMDM were left untreated (E) or primed with LPS (100 ng/ml) for 4 h (F), prior to infection with the indicated UPEC strains (WT denotes wild type, pSU2718 is the empty vector control, pHlyCABD is a plasmid expressing the entire hemolysin operon) at MOI 10. (E) Culture supernatants were collected at 2 h pi and analyzed for LDH release. (F) Culture supernatants (2 h pi) were analyzed for IL-1β release by ELISA. Data is from single experiment performed in experimental triplicate (mean+range), and similar observations were made in three independent experiments.

Figure 3. cof is required for maximal CFT073-mediated human macrophage cell death. (A) HMDM were infected with CFT073 TM or the CFT073 TM Tn5-cof mutant at MOI 10. Cell death was measured at 4, 8 or 24 h pi using LDH release assays. Data (mean + sem; n = 3) were combined from three independent experiments performed in experimental triplicate (each experiment using a different donor). Statistical significance was determined by a two-tailed t-test (#p < 0.05, ##p < 0.01, ###p < 0.001). (B) HMDM were infected with wild type CFT073 or the CFT073Δcof over the indicated MOI range. Cell death was quantified by LDH release assays, using supernatants collected at 4, 8 or 24 h pi. Data (mean+sem; n = 6) are combined from six independent experiments performed in experimental triplicate (each experiment using a different donor). Statistical significance was determined by a paired two-tailed t-test (#p < 0.05, ##p<0.01, ###p < 0.001, ####p < 0.0001). ns = not significantly different. (C) HMDM were primed with LPS (100 ng/ml) for 4 h prior to infection with the indicated strains. Culture supernatants were analyzed for IL-1β release at 4 h pi. Data (mean + sem; n = 6) are combined from six independent experiments performed in experimental triplicate (each experiment using a different donor). Statistical significance was determined by a two-tailed t-test (#p < 0.05). Connecting lines represent the results of a single experiment using one donor (for CFT073 TM vs CFT073 TM Tn5-cof or CFT073 vs CFT073Δcof).
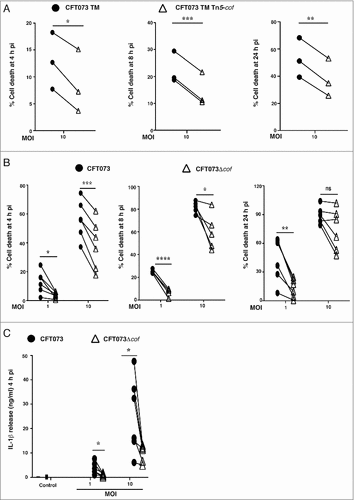
Figure 3. cof is required for maximal CFT073-mediated human macrophage cell death. (A) HMDM were infected with CFT073 TM or the CFT073 TM Tn5-cof mutant at MOI 10. Cell death was measured at 4, 8 or 24 h pi using LDH release assays. Data (mean + sem; n = 3) were combined from three independent experiments performed in experimental triplicate (each experiment using a different donor). Statistical significance was determined by a two-tailed t-test (#p < 0.05, ##p < 0.01, ###p < 0.001). (B) HMDM were infected with wild type CFT073 or the CFT073Δcof over the indicated MOI range. Cell death was quantified by LDH release assays, using supernatants collected at 4, 8 or 24 h pi. Data (mean+sem; n = 6) are combined from six independent experiments performed in experimental triplicate (each experiment using a different donor). Statistical significance was determined by a paired two-tailed t-test (#p < 0.05, ##p<0.01, ###p < 0.001, ####p < 0.0001). ns = not significantly different. (C) HMDM were primed with LPS (100 ng/ml) for 4 h prior to infection with the indicated strains. Culture supernatants were analyzed for IL-1β release at 4 h pi. Data (mean + sem; n = 6) are combined from six independent experiments performed in experimental triplicate (each experiment using a different donor). Statistical significance was determined by a two-tailed t-test (#p < 0.05). Connecting lines represent the results of a single experiment using one donor (for CFT073 TM vs CFT073 TM Tn5-cof or CFT073 vs CFT073Δcof).

Figure 4. Cof regulates levels of secreted hemolysin. (A) HMDM were treated with the supernatants from the indicated bacterial strains (WT denotes wild type). Culture supernatants were analyzed for cell death at 8 h pi, using LDH release assays. Data (mean+sem, n = 3) are combined from three independent experiments performed in experimental triplicate (each experiment using a different donor). Statistical significance was determined by one-way ANOVA, followed by Dunnett's multiple comparison test (###p < 0.001, ####p < 0.0001). (B) Overnight cultures of the indicated UPEC strains (WT denotes wild type) were incubated for 4 h with 5% sheep blood, after which hemolytic activity was measured. The hlyA−ve strain EC958 was used for background correction in these experiments, and data (mean+sem; n = 3) are combined from three independent experiments performed in experimental triplicate. Statistical significance was determined by one-way ANOVA, followed by Dunnett's multiple comparison test (####p < 0.0001). (C) Supernatants from the indicated bacterial strains (grown overnight) were concentrated (WT denotes wild type) and lysates from matched cell pellets were generated. The samples were analyzed for hemolysin expression by western blotting using antibodies targeting HlyA (the full-length HlyA migrated at ∼120 kDa, in contrast to its predicted size of ∼110 kDa). OmpA expression was used as a loading control for the cell lysates. Similar results were obtained in five independent experiments. (D) Levels of HlyA in supernatants, relative to OmpA levels in lysates from matched cell pellets for each strain, were determined by immunoblotting (using ImageJ/Image analyzer (Amersham 600)). For each experiment, the HlyA levels in wild type CFT073 were set at 100%. Data (mean+sem; n = 5) are combined from five independent experiments. Statistical significance was determined by one-way ANOVA, followed by Dunnett's multiple comparison test (##p < 0.01). (E-F) Levels of hlyA (E) and hlyC (F) mRNA, relate to gapA, in the indicated UPEC strains (WT denotes wild type) were determined by qRT-PCR. Data (mean+sem; n = 4) are combined from four independent experiments. ND = not detected.
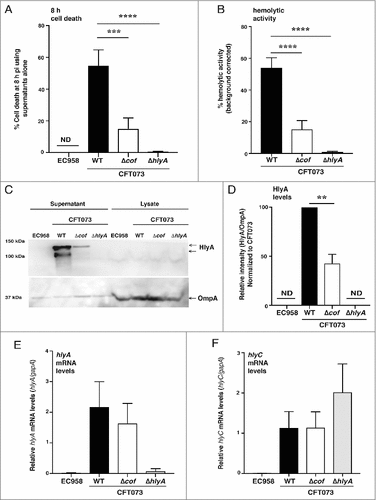
Figure 4. Cof regulates levels of secreted hemolysin. (A) HMDM were treated with the supernatants from the indicated bacterial strains (WT denotes wild type). Culture supernatants were analyzed for cell death at 8 h pi, using LDH release assays. Data (mean+sem, n = 3) are combined from three independent experiments performed in experimental triplicate (each experiment using a different donor). Statistical significance was determined by one-way ANOVA, followed by Dunnett's multiple comparison test (###p < 0.001, ####p < 0.0001). (B) Overnight cultures of the indicated UPEC strains (WT denotes wild type) were incubated for 4 h with 5% sheep blood, after which hemolytic activity was measured. The hlyA−ve strain EC958 was used for background correction in these experiments, and data (mean+sem; n = 3) are combined from three independent experiments performed in experimental triplicate. Statistical significance was determined by one-way ANOVA, followed by Dunnett's multiple comparison test (####p < 0.0001). (C) Supernatants from the indicated bacterial strains (grown overnight) were concentrated (WT denotes wild type) and lysates from matched cell pellets were generated. The samples were analyzed for hemolysin expression by western blotting using antibodies targeting HlyA (the full-length HlyA migrated at ∼120 kDa, in contrast to its predicted size of ∼110 kDa). OmpA expression was used as a loading control for the cell lysates. Similar results were obtained in five independent experiments. (D) Levels of HlyA in supernatants, relative to OmpA levels in lysates from matched cell pellets for each strain, were determined by immunoblotting (using ImageJ/Image analyzer (Amersham 600)). For each experiment, the HlyA levels in wild type CFT073 were set at 100%. Data (mean+sem; n = 5) are combined from five independent experiments. Statistical significance was determined by one-way ANOVA, followed by Dunnett's multiple comparison test (##p < 0.01). (E-F) Levels of hlyA (E) and hlyC (F) mRNA, relate to gapA, in the indicated UPEC strains (WT denotes wild type) were determined by qRT-PCR. Data (mean+sem; n = 4) are combined from four independent experiments. ND = not detected.
Supplemental material

Murthy_Supplementary_Revision2.docx

Download MS Word (2.5 MB)