Figures & data
Figure 1. Pathogenicity of CK10 and GS10 in mice. (A) Mean weight loss of mice infected with 105.0 EID50 of CK10 and GS10 viruses (n = 5). Mice were humanely killed when they lost ≥ 25% of their initial body weight. Error bar represents stand deviation (SD). (B) Survival rate of mice infected with the indicated viruses (n = 5). (C) Viral replication in the mouse lung. Values shown are the mean ± SD of the results from five individuals (*p < 0.05). Asterisk indicates significant difference between the CK10 and the GS10 virus. (D) – (F) Cytokines and chemokines expression in the mouse lung. Levels of cytokine or chemokine were expressed as the mean fold change ± standard error (SE) of the mean. *p < 0.05 and **p < 0.01, asterisk or double asterisk indicates significant difference between CK10 and GS10. (G) and (H) Representative histopathological changes in H&E (hematoxylin and eosin)-stained lung tissues on day 1 p.i.. (G) CK10 virus-infected mouse lung. Pulmonary alveolar hemorrhage (shown as asterisk), bronchial mucosa injury and accompany by inflammatory cells infiltration around the bronchus (shown as black arrow). (H) GS10 virus-infected mouse lung. No obvious histopathology was observed in the GS10 virus-infected mouse lung.
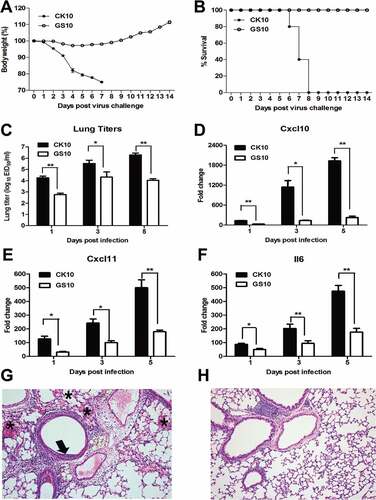
Figure 2. Analysis of the lncRNA data. (A) Region distribution of the tested reads. Results shown are the region distribution of the tested reads, including gene, coding region, splicing, intron, non-coding region and intergenic. Among them, 5-UTR, 3-UTR, non-coding RNA regions are covered in non-coding region. (B) Numbers of significantly differentially expressed (SDE) lncRNAs in the process of infection with CK10 or GS10 relative to mock (p < 0.05, fold change > 1.5 or < 0.67). (C) Numbers of SDE mRNAs in the process of infection with CK10 or GS10 relative to mock (p < 0.05, fold change > 1.5 or < 0.67). (D) Venn diagram showing the distribution of SDE lncRNAs in the process of infection with CK10 or GS10. (E) Venn diagram showing the distribution of SDE mRNAs in the process of infection with CK10 or GS10 viruses.
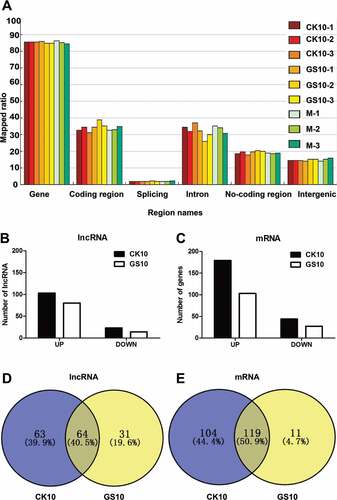
Figure 3. The lncRNA/mRNA coexpression network constructed using the cytoscape program for the CK10 group. The lncRNAs and mRNAs with Pearson correlation coefficients ≥ 0.99 or ≤ −0.99 were selected to draw the regulatory network using the cytoscape program. In gene-coexpression networks, each gene corresponds to a node. Two genes are connected by an edge, indicating a strong correlation. Within the network analysis, a degree is the simplest, most important measure of the centrality of a gene within a network and determines the relative importance. A degree is defined as the number of directly linked neighbors. In the network, the node size indicates the node degrees and the number represents the number of directly linked neighbours that are associated with each color. Therefore, the larger the node size suggested the targeted lncRNA or mRNA could directly linked with more neighboring genes.
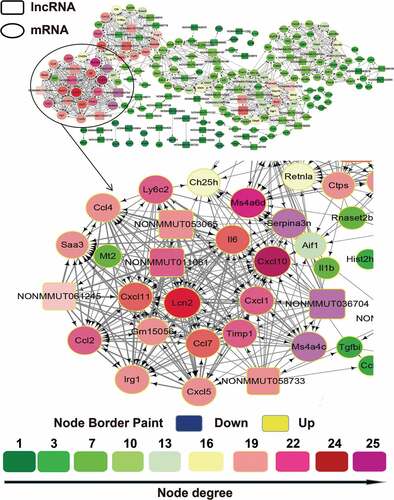
Figure 4. Disease and bio-functional categories of the lncRNAs-coexpressed mRNAs induced by CK10 or GS10 by IPA analysis. (A) Important bio-functions associated with the lncRNAs-coexpressed mRNAs. ‘*’, indicates the P value of the CK10 virus-infected group was above 2-fold than that of GS10. (B) Crucial bio-functions related to inflammatory responses that were highly induced by CK10.
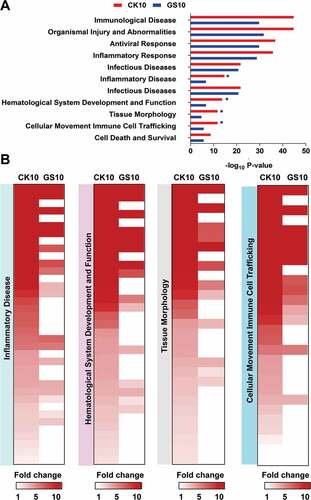
Figure 5. Canonical pathways of the lncRNAs-coexpressed mRNAs stimulated by CK10 or GS10 by IPA analysis. (A) The top canonical pathways associated with the lncRNAs-coexpressed mRNAs. (B) The expression profiles of the lncRNAs-coexpressed mRNAs related to the ‘Activation of IRF by Cytosolic Pattern Recognition Receptors’ top 1 pathway for the CK10 group. (C) The expression profiles of the lncRNAs-coexpressed mRNAs related to the ‘Agranulocyte Adhesion and Diapedesis’ top 2 pathway for the CK10 group. (D) The expression profiles of the lncRNAs-coexpressed mRNAs related to the ‘Interferon Signaling’ top 3 pathway for the CK10 group. (E) The expression profiles of the lncRNAs-coexpressed mRNAs related to the ‘Antigen Presentation Pathway’ top 4 pathway for the CK10 group. (F) The detail presentation of top 1 canonical pathway ‘Activation of IRF by Cytosolic Pattern Recognition Receptors’ induced by CK10.
Figure 6. Validation of the RNA-sequencing data. (A) Alteration of the expression of the selected lncRNAs in CK10- or GS10-infected mouse lungs at 24 h p.i. was analyzed by qRT-PCR. Values shown are the mean fold change ± SE of the results from three individuals (*p < 0.05). Asterisk indicates a significant difference between CK10 and GS10. (B) RNA-sequencing results of the targeted lncRNAs were shown as control. (C) Alteration of the expression of the selected mRNAs in CK10- or GS10-infected mouse lungs at 24 h p.i. was analyzed by qRT-PCR. Values shown are the mean ± SD of the results from three individuals (*p < 0.05, **p < 0.01). Asterisk indicates a significant difference between CK10 and GS10. (D) RNA-sequencing results of the selected mRNAs were shown for comparison.
Figure 7. Potential relevance of NONMMUT011061 with virulence of H5 IAV in mice. Groups of nine mice were infected with CK10, GS10 or QD5 (a H5N8 strain that is also highly pathogenic in mice). (A) The expression pattern of NONMMUT011061 was determined in the mouse lung at day 1, 2 and 3 p.i. Values are expressed as the mean fold change ± SE of the mean from three individuals. (B) Virus titers in the lungs. Values shown are the mean ± SD of the results from three individuals (*p < 0.05, **p < 0.01). Asterisk indicates a significant difference between highly pathogenic viruses (CK10 or QD5) and GS10. (C) The expression pattern of NONMMUT036704 was determined in the mouse lung at day 1, 2 and 3 p.i. Values are expressed as the mean fold change ± SE of the mean from three individuals.
Table 1. Top protein that might interact with NONMMUT011061.
Figure 8. Prediction of the potential transcriptional factors (TFs) of the NONMMUT011061. The TRANSFAC database was used to predict the TFs associated with NONMMUT011061 (http://www.gene-regulation.com/index2.html).
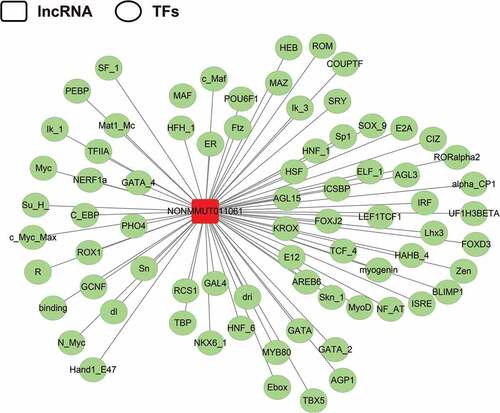
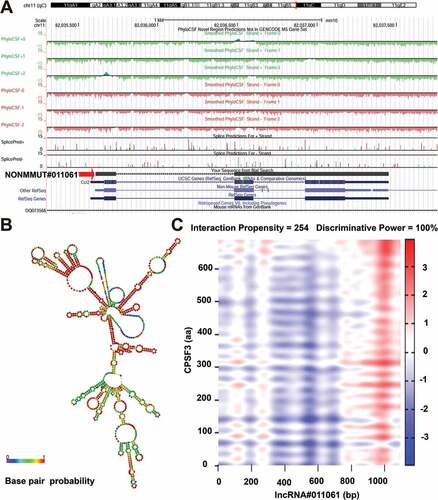
Figure 9. Bioinformatics analysis of NONMMUT011061. (A) The chromosome location of NONMMUT011061 in the mouse genome was shown. (B) Prediction of RNA secondary structure for NONMMUT011061 (RNAfold web server, University of Vienna). A minimal free energy structure (MFE = −396.90 kcal/mol) was shown. Base pairing probabilities have been color-coded using a scale from 0 (blue) to 1 (red). (C) catRAPID analysis indicated a strong interaction between CPSF3 and NONMMUT011061.