Figures & data
Table 1. Six up-regulated genes from the RNA sequencing data analysis and their homologues in C. albicans and their fold change expression values in C. parapsilosis.
Table 2. Confirmation of the RNA sequencing data: fold change values of the 6 selected genes in both C. parapsilosis strains determined by qRT-PCR analysis.
Figure 1. RNA sequencing and data analysis. (a) Global gene expression analysis was performed on the wild type C. parapsilosis strain after 3 hours of growth in presence of arachidonic acid. Functional analysis of genome wide expression data suggests that lipid metabolism and transport related pathways are significantly altered in the presence of arachidonic acid. (b) Heat map shows all the C. parapsilosis genes upregulated in presence of arachidonic acid. For further information see supplementary table S1.
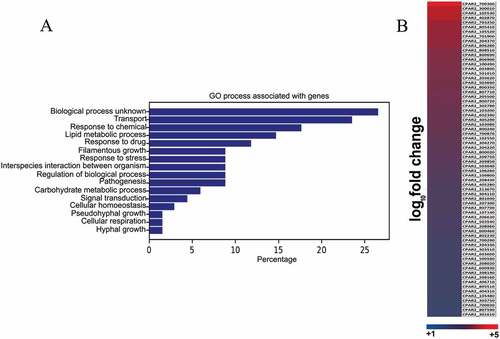
Figure 2. Reduced eicosanoid production by C. parapsilosis mutant strains. C. parapsilosis CLIB 214 wild type strain and three null mutant strains 603600Δ/Δ, 800020Δ/Δ and 807710Δ/Δ were grown for 24 hours at 30°C in the presence of 100 μM arachidonic acid in PBS. PBS with only arachidonic acid served as control. After sterile filtration, 100 µl of cell-free samples were analyzed with LC/MS. Among the examined eicosanoids, the three null mutants showed significant reductions in PGE2 (CPAR2_603600Δ/Δ, CPAR2_800020Δ/Δ and CPAR2_807710Δ/Δ) and one strain in 15-keto-PGE2 (CPAR2_807710∆/∆) production. Strains 603600∆/∆ and 800020∆/∆ had a strong trend toward a lower production of PGD2 compared to the wild type strain. *P < 0.05, **P < 0.01.
Figure 3. Suggestive identification and measurement of fungal 5D2-IsoP in wild type and eicosanoid mutant strains. Upper left, LC/MS analysis of cell supernatant after growing C. parapsilosis wild type strain in presence of 100 μM arachidonic acid in PBS. Blue trace shows the elution of an authentic LXA4 standard (1 ng/mL) in the transition m/z 351-> 115. Red trace shows the elution of an overlapping signal in a representative C. parapsilosis sample. (Upper right) MS/MS spectrum of the signal co-eluting with LXA4 and chemical structure of the candidate molecule 5D2-IsoP. Middle MS3 spectra of m/z 271 (left) and m/z 217 (right). Lower panel, CPAR2_800020Δ/Δ showed a significant reduction in 5D2-IsoP production, although 5D2-IsoP levels also decreased in CPAR2_603600Δ/Δ and CPAR2_807710Δ/Δ strains.
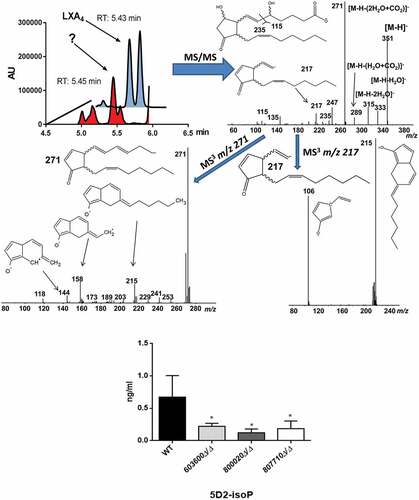
Figure 4. Phagocytosis of wild type and eicosanoid mutant strains by human macrophages by imaging flow cytometry. The phagocytosis of wild type and C. parapsilosis eicosanoid mutant cells by PBMC-DMs was analyzed by an imaging flow cytometer. Yeast cells were labeled with AlexaFluor447 and co-incubated with macrophages for 2 hours at 37°C with 5% CO2. Data were obtained from three independent experiments. Representative dot plots and summarized data of the flow cytometric analysis are shown. *P < 0.05.
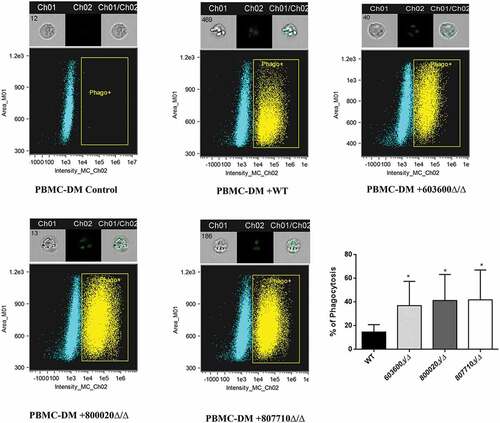
Figure 5. Killing of C. parapsilosis strains by human PBMC-DMs and host cell damage. (a) The efficiency of killing by human macrophages was analyzed by CFU determination. Experiments were performed in triplicates. The obtained data represents the killing efficiency of macrophages gained from 5 healthy donors. (b) Human PBMC-DMs were infected with wild type and C. parapsilosis eicosanoid mutants for 24 hours and LDH release was measured. LDH release is expressed as % of positive control. *P < 0.05, **P < 0.01, ***p < 0.002, ****p < 0.0001.
Figure 6. Phagocytic competition assay. The competition assays were performed using combinations of GFP tagged wild type C. parapsilosis and mCherry tagged eicosanoid mutant strains. Equal numbers of yeast cells expressing GFP or mCherry were mixed together and added to human PBMC-DMs at the MOI of 1:2. (a) Significantly higher number of mutant cells (red) were internalized compared to the wild type cells (green). (b) Percentage of phagocytic macrophages in each case (c) Number of macrophages with both wild type and mutant strain in each case did not show any difference. **P < 0.01, ***p < 0.002.
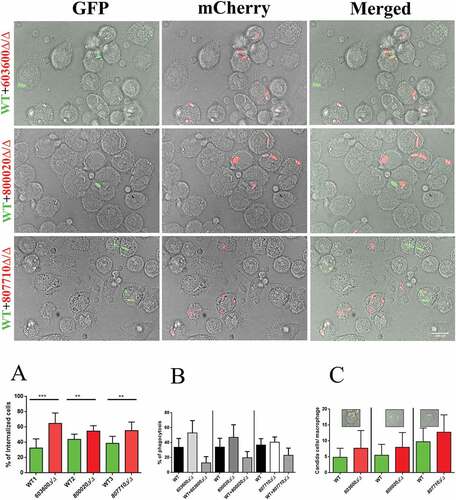
Figure 7. Phagosome-lysosome fusion in response to wild type and eicosanoid mutants. Phago-lysosome co-localization in human PBMC-DMs following the phagocytosis of pHrodo labeled Candida cells. Representative picture of a phagocytosing macrophage during quantitative imaging analysis. Ch1: brightfield image, Ch3: green fluorescence channel. Graph showing the difference between the extent of phago-lysosome fusion in case of the wild type and the mutants. *P < 0.05.
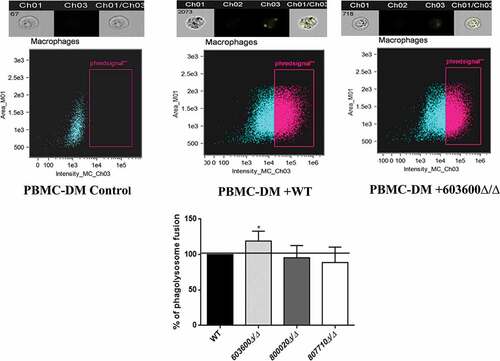
Figure 8. Cytokine secretion of human macrophages in response to wild type and eicosanoid mutants. (a) Pro IL-1β, IL-1ra, TNFα, IL-6, IL-8, and IL-10 levels were measured by ELISA after stimulation of PBMC-DMs with wild type or eicosanoid mutant strains for 24 hours. Data were normalized for each donor to cytokine levels induced by the wild type strain (100%) to minimize donor to-donor variability. (b) IL-1β, TNFα and IL-10 were also measured after infection of human PBMCs with the same strains. Data represent % cytokine production ± SEM for 6 donors. *P < 0.05.
Figure 9. Fungal burden in organs after intravenous infection. Five mice were infected intravenously with 2 × 10⁷/100 µl of C. parapsilosis wild type or eicosanoid mutant cells. CFUs recovered from kidney (a), liver (b), and spleen (c) after 3 days of the infection. The results are pooled data from two independent experiments. *P < 0.05, **P < 0.01, ***p < 0.002, ****p < 0.0001.