2,128
Views
13
CrossRef citations to date
0
Altmetric
Research Paper

Biguanides enhance antifungal activity against Candida glabrata

, , , , , , , , , , , , ORCID Icon & show all
Pages 1150-1162 | Received 04 Apr 2018, Accepted 08 May 2018, Published online: 01 Aug 2018

Figures & data

Table 1. MIC50 of various Candida species.

Figure 1. Metformin demonstrates antifungal activity against C. glabrata. (A) Prestoblue assay. Wild type C. glabrata were treated with a range of metformin concentrations, with Prestoblue fluorescence read at 18hrs. Arbitrary units (AU) for fluorescence plotted on the y-axis. Data points were fitted to a four-parameter logistic curve. (B) CFU assay. Wild type C. glabrata was treated with metformin for 18hrs, resuspended and plated onto YPD agar plates for 24-48hrs at 30°C. Data are plotted as fold population change compared to initial inoculum. ** denotes p ≤ 0.01, ns = not significant. Data represent 3 independent experiments.
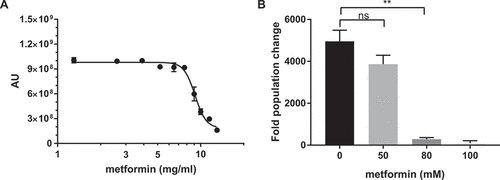
Figure 1. Metformin demonstrates antifungal activity against C. glabrata. (A) Prestoblue assay. Wild type C. glabrata were treated with a range of metformin concentrations, with Prestoblue fluorescence read at 18hrs. Arbitrary units (AU) for fluorescence plotted on the y-axis. Data points were fitted to a four-parameter logistic curve. (B) CFU assay. Wild type C. glabrata was treated with metformin for 18hrs, resuspended and plated onto YPD agar plates for 24-48hrs at 30°C. Data are plotted as fold population change compared to initial inoculum. ** denotes p ≤ 0.01, ns = not significant. Data represent 3 independent experiments.

Figure 2. Antifungal activity is a shared feature of the biguanide family. Wild type C. glabrata were incubated with phenformin (A) or buformin (B) in the presence of Prestoblue for 18h at 30°C and arbitrary units for fluorescence determined (AU). (C) As a drug concentration control, C. glabrata was incubated with ampicillin. Data points were fitted to a four-parameter logistic curve and represent 3 independent experiments.
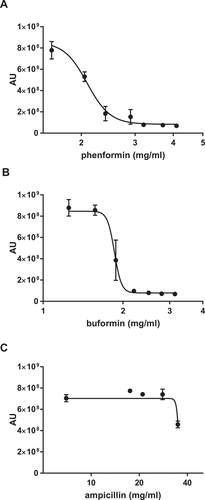
Figure 2. Antifungal activity is a shared feature of the biguanide family. Wild type C. glabrata were incubated with phenformin (A) or buformin (B) in the presence of Prestoblue for 18h at 30°C and arbitrary units for fluorescence determined (AU). (C) As a drug concentration control, C. glabrata was incubated with ampicillin. Data points were fitted to a four-parameter logistic curve and represent 3 independent experiments.

Figure 3. Inhibition of mTORC1 complex and AMPK, but not complex I, demonstrates anti-C. glabrata activity. Wild type C. glabrata were incubated with mTORC1 inhibitor rapamycin (A), mitochondrial complex I inhibitor rotenone (B), and AMPK agonist AICAR (C), in the presence of Prestoblue for 18h at 30°C. Yeast growth was expressed as arbitrary units for Prestoblue fluorescence (AU). *** denotes p ≤ 0.001, **** p ≤ 0.0001, ns = not significant. Data represent 3 independent experiments.
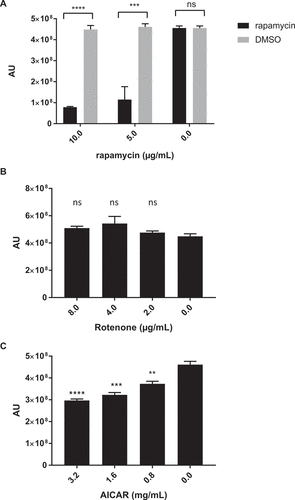
Figure 3. Inhibition of mTORC1 complex and AMPK, but not complex I, demonstrates anti-C. glabrata activity. Wild type C. glabrata were incubated with mTORC1 inhibitor rapamycin (A), mitochondrial complex I inhibitor rotenone (B), and AMPK agonist AICAR (C), in the presence of Prestoblue for 18h at 30°C. Yeast growth was expressed as arbitrary units for Prestoblue fluorescence (AU). *** denotes p ≤ 0.001, **** p ≤ 0.0001, ns = not significant. Data represent 3 independent experiments.

Table 2. ƩFIC of biguanides and antifungals.

Figure 4. Combination therapy of metformin with common antifungal agents reduces C. glabrata activity. (A) Wild type C. glabrata treated with 6.5 mg/mL metformin in combination with voriconazole, fluconazole, amphotericin or micafungin in the presence of Prestoblue for 18hrs at 30°C. AU represent Prestoblue fluorescence unit. Data points were fitted to a four-parameter logistic curve. (B) MIC50 were determined from four-parameter logistic curves comparing control antifungal drug with metformin combination. (C) C. glabrata was treated with voriconazole, metformin, or the combination for 18hrs, resuspended and plated onto YPD agar plates for 24-48hrs at 30°C. Data are plotted as fold population change compared to initial inoculum. * denotes p ≤ 0.05, ** p ≤ 0.01. Data represent 3 independent experiments.
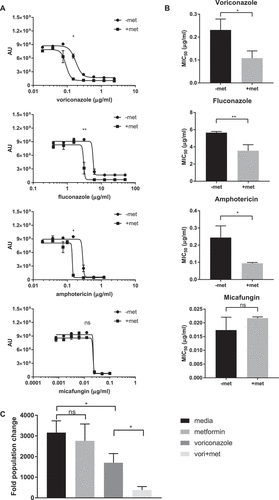
Figure 4. Combination therapy of metformin with common antifungal agents reduces C. glabrata activity. (A) Wild type C. glabrata treated with 6.5 mg/mL metformin in combination with voriconazole, fluconazole, amphotericin or micafungin in the presence of Prestoblue for 18hrs at 30°C. AU represent Prestoblue fluorescence unit. Data points were fitted to a four-parameter logistic curve. (B) MIC50 were determined from four-parameter logistic curves comparing control antifungal drug with metformin combination. (C) C. glabrata was treated with voriconazole, metformin, or the combination for 18hrs, resuspended and plated onto YPD agar plates for 24-48hrs at 30°C. Data are plotted as fold population change compared to initial inoculum. * denotes p ≤ 0.05, ** p ≤ 0.01. Data represent 3 independent experiments.

Figure 5. Metformin reduces C. glabrata proliferation by slowing division rate. (A) Time lapse microscopy of live wild type C. glabrata over 20hrs in a humidified microscopy chamber at 30°C. Images show frame at 8hrs (supplemental video displays entire time course). Scale bar represents 50µm. (B) Flow cytometry division measurement of CFSE-labeled C. glabrata. CFSE-bright undivided yeast population shown at t = 0 is then incubated in media, metformin (6.5mg/ml), voriconazole (40µg/mL) or combination. Percent (scatter plot inset) of undivided CFSE-bright population was determined over time indicated. Representative scatter flow plots shown at 8hrs, and (C) percent undivided population shown over time. (D) C. glabrata doubling time was determined from flow cytometry CFSE measurements for yeast incubated in media, metformin, voriconazole and combination treatment. * denotes p ≤ 0.05, **** p ≤ 0.0001. Data represent a minimum of 3 independent experiments.
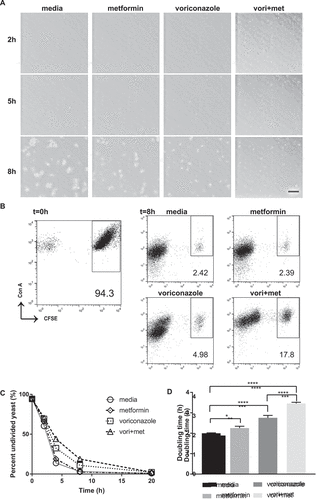
Figure 5. Metformin reduces C. glabrata proliferation by slowing division rate. (A) Time lapse microscopy of live wild type C. glabrata over 20hrs in a humidified microscopy chamber at 30°C. Images show frame at 8hrs (supplemental video displays entire time course). Scale bar represents 50µm. (B) Flow cytometry division measurement of CFSE-labeled C. glabrata. CFSE-bright undivided yeast population shown at t = 0 is then incubated in media, metformin (6.5mg/ml), voriconazole (40µg/mL) or combination. Percent (scatter plot inset) of undivided CFSE-bright population was determined over time indicated. Representative scatter flow plots shown at 8hrs, and (C) percent undivided population shown over time. (D) C. glabrata doubling time was determined from flow cytometry CFSE measurements for yeast incubated in media, metformin, voriconazole and combination treatment. * denotes p ≤ 0.05, **** p ≤ 0.0001. Data represent a minimum of 3 independent experiments.

Figure 6. Metformin enhances antifungal activity against drug resistant C. glabrata isolates. Fluconazole-resistant clinical C. glabrata isolates were incubated with 3.9 mg/mL of metformin and voriconazole (A) or fluconazole (B). The MIC50 to each antifungal agent was determine with and without metformin. (C) Echinocandin and fluconazole double-resistant strain FR/MR was incubated with metformin and increasing amounts of micafungin. Micafungin MIC50 was determined for strain FR/MR with and without metformin. * denotes p ≤ 0.05, ** p ≤ 0.01. Data represent a minimum of 3 independent experiments.
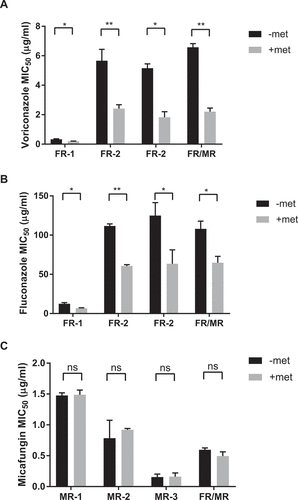
Figure 6. Metformin enhances antifungal activity against drug resistant C. glabrata isolates. Fluconazole-resistant clinical C. glabrata isolates were incubated with 3.9 mg/mL of metformin and voriconazole (A) or fluconazole (B). The MIC50 to each antifungal agent was determine with and without metformin. (C) Echinocandin and fluconazole double-resistant strain FR/MR was incubated with metformin and increasing amounts of micafungin. Micafungin MIC50 was determined for strain FR/MR with and without metformin. * denotes p ≤ 0.05, ** p ≤ 0.01. Data represent a minimum of 3 independent experiments.
Supplemental material

Supplemental Material

Download MS Word (13.4 KB)