
Figures & data
Figure 1. Cytokine and AMP mRNA expression in response to keratinocyte infection by each kind of bacterial strain. IL-1β (A), IL-6 (B), IL-23α (C), IL-32 (D), TSLP (E), TNFα (F), hBD2 (G) and S100A7 (H) mRNA expression by keratinocytes infected for 6 h with wild-type PAK strain, PAK ∆fliC (Fla−), PAK∆xcpQ (T2SS − ), PAK∆pscF (T3SS − ), PAK ∆fliC∆xcpQ∆pscF (Fla− /T2SS − /T3SS − ) strains or wild-type PAK strain in presence of the anti-TLR5 monoclonal antibody. mRNA expression levels are expressed as the fold increase above unstimulated cultures. Data are represented as mean + SEM of five independent experiments. *p < 0.05, **p < 0.01 and *** p < 0.001.
Figure 2. Chemokine mRNA expression and secretion in response to keratinocyte infection by each kind of bacterial strain and inflammatory response to flagellin stimulation. CXCL1, CXCL8, CCL20 mRNA expression (A to C) and secretion (D to F) by keratinocytes infected for 6 h with wild-type PAK strain, PAK ∆fliC (Fla−), PAK ∆xcpQ (T2SS − ), PAK ∆pscF (T3SS − ), PAK ∆fliC∆xcpQ∆pscF (Fla− /T2SS − /T3SS − ) strains or wild-type PAK strain in presence of the anti-TLR5 monoclonal antibody. mRNA expression levels are expressed as the fold increase above unstimulated cultures. Protein concentrations (pg/mL) were measured in culture supernatants by ELISA assays. G: Cytokine, chemokine and AMP mRNA induction after 6 h of keratinocyte stimulation with purified flagellin from P. aeruginosa (1 µg/mL). Data are represented as mean + SEM of five independent experiments. *p < 0.05, **p < 0.01 and *** p < 0.001.
Figure 3. Cytokine and AMP mRNA expression in response to RHE infection by each kind of bacterial strain. IL-1β (A), IL-6 (B), IL-23α (C), IL-32 (D), TSLP (E), TNFα (F), hBD2 (G), S100A7 (H) mRNA expression in fold increase by RHE infected for 16 h with wild-type PAK strain, PAK ∆fliC (Fla−), PAK ∆xcpQ (T2SS − ), PAK ∆pscF (T3SS − ), PAK ∆fliC∆xcpQ∆pscF (Fla− /T2SS − /T3SS − ) strains. mRNA expression levels are expressed as the fold increase above unstimulated cultures. Data are represented as mean + SEM of three independent experiments. *p < 0.05 and **p < 0.01.
Figure 4. Chemokine mRNA expression in response to RHE infection by each kind of bacterial strain and inflammatory response to flagellin stimulation. CXCL1, CXCL8, CCL20 mRNA expression (A to C) and secretion (D to F) by RHE infected with wild-type PAK strain, PAK ∆fliC (Fla−), PAK ∆xcpQ (T2SS − ), PAK ∆pscF (T3SS − ) or PAK ∆fliC∆xcpQ∆pscF (Fla− /T2SS − /T3SS − ) strains. G: Cytokine, chemokine and AMP mRNA induction after 16 h of RHE stimulation with purified flagellin from P. aeruginosa (1µg/mL) in culture medium. mRNA expression levels are expressed as the fold increase above unstimulated cultures. Protein concentrations (pg/mL) were measured in culture supernatants by ELISA assays. Data are represented as mean + SEM of five independent experiments. *p < 0.05, **p < 0.01 and *** p < 0.001.
Figure 5. A to H: Level of S100A7 tissue production (red) assessed by immunohistochemistry on RHE infected with the different PAK strains of P. aeruginosa for 24 h. Nuclei were counter-stained using a hematoxylin solution (blue). A: control (sterile PBS), B: wild-type PAK strain, C: PAK ∆fliC (Fla−), D: PAK ∆xcpQ (T2SS − ), E: PAK ∆pscF (T3SS − ), F: PAK ∆fliC∆xcpQ∆pscF (Fla− /T2SS − /T3SS − ), G: ultrapure flagellin deposited in culture medium, H: ultra-pure flagellin deposited on the upper layer of RHE. I to P: Immunofluorescence assays (green) using a polyclonal anti-P. aeruginosa antibody on RHE infected with the different PAK strains. Nuclei were counter-stained using a solution of propidium iodide red-fluorescent staining. I: control (sterile PBS), J: wild-type PAK strain, K: PAK ∆fliC (Fla−), L: PAK ∆xcpQ (T2SS − ), M: PAK ∆pscF (T3SS − ), N: PAK ∆fliC∆xcpQ∆pscF (Fla− /T2SS − /T3SS − ), O: ultrapure flagellin deposited in culture medium, P: ultra-pure flagellin deposited on the upper layer of RHE.
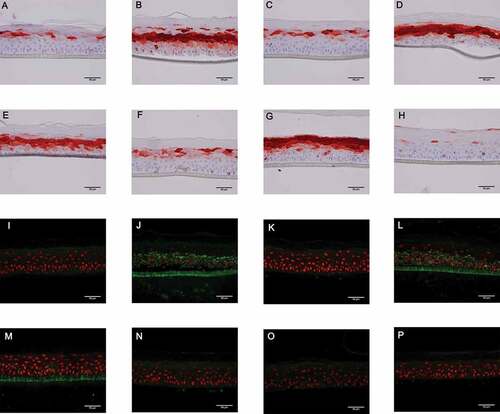
Figure 6. Flagellum promotes P. aeruginosa persistence in cutaneous infection. (A) Balb/c mice were inoculated with 1.107 CFU of either PAK-lux (●) or PAK ∆fliC-lux (□) strains. Infection was assessed by quantifying luminescence emission on living animals. Data represent the mean ± SEM (n = 4–5 mice/group). *p < 0.05. (B) Pictures of luminescence imaging on living animals recorded immediately after infection (D0) and after 4 days (D4) post-inoculation.
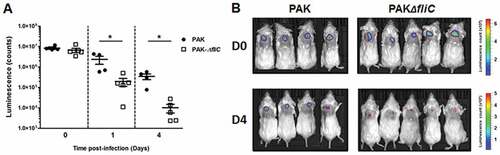
Table 1. Strains and plasmids used in this study.