Figures & data
Figure 1. The expression of Th cell-associated specific transcription factors in the spleen cells from CVB3-infected mice (n = 5 in each group). Nicotine upregulated GATA3 and Foxp3 expression, while it downregulated T-bet and ROR-γ expression. A. Representative levels of the specific transcription factors. B. Absolute intensity ratio of the specific transcription factors to Gapdh. *P < 0.05 versus the PBS group and #P < 0.05 versus the methyllycaconitine group.
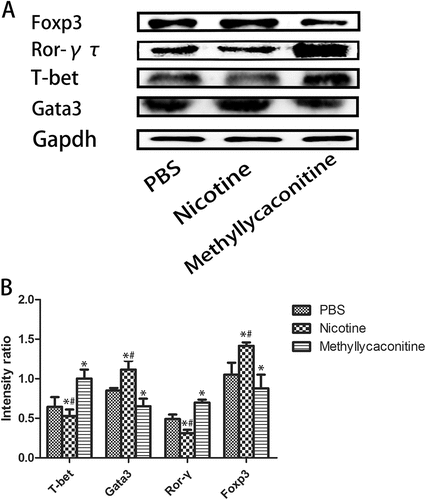
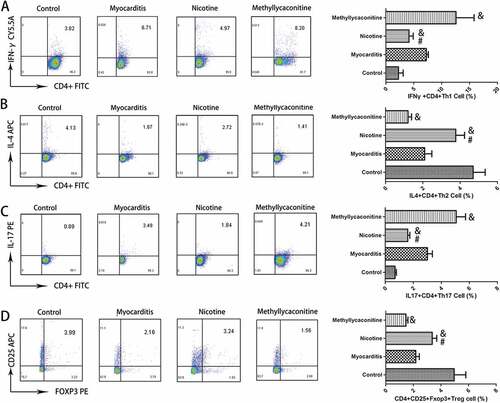
Figure 2. The percentage of Th cell subsets in the spleen from CVB3-infected mice (n = 5 in each group). The percentages of IFN-γ+ CD4+ Th1 and IL-17+ CD4+ Th17 cells were increased in the MLA group, but they were decreased in the nicotine group. CD4, IFN-γ, IL-4, IL-17, CD25 and Foxp3 were labeled by FITC, PE-CY5.5, APC, PE, APC, and PE, respectively. A, B, C and D are the representative results for each group and the percentage of double positive cells. *P < 0.05 versus the PBS group and #P < 0.05 versus the methyllycaconitine group.
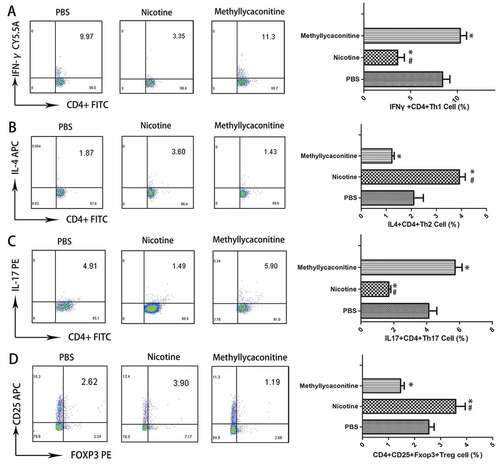
Figure 3. Survival rate (n = 40 in each group) and Viral replication in the myocardium (n = 5 in each group). A. The survival curve of each group. B. Viral replication in the myocardium of each group.
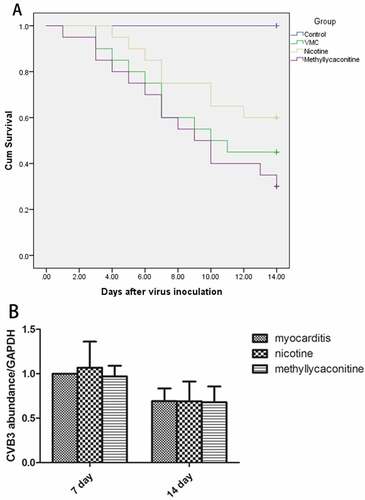
Figure 4. Myocardial histopathology changes for each group (n = 5 in each group). A and E show the lack of histopathology changes for the control group on days 7 and 14; B and F show representative histopathology changes for the myocarditis group on days 7 and 14. Several small foci of cellular infiltrations are shown; C and G show representative histopathological changes for the nicotine group on days 7 and 14. The extent of cellular infiltration was less severe in the nicotine group than in the methyllycaconitine and myocarditis groups; small and limited foci of cellular infiltrations were obtained. D and H show representative histopathological changes for the methyllycaconitine group on days 7 and 14. Several large foci of cellular infiltrations are obtained. I and H are the Box-plots of the histopathology scores for each group on days 7 and 14. The score of the nicotine group was significantly lower than those of the myocarditis and methyllycaconitine groups. &P < 0.05 versus the myocarditis group and #P < 0.05 versus the methyllycaconitine group.
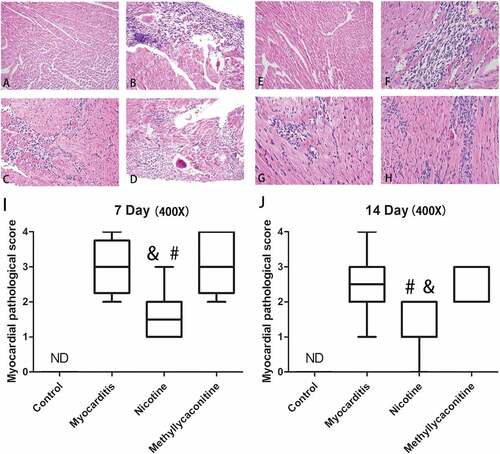
Figure 5. Expression of pro-inflammatory cytokines in the heart (n = 5 in each group). A. Nicotine treatment significantly deceased the expression of IL-1, IL-6 and TNF-α compared with the myocarditis group on day 7. B. On day 14, no significant differences were found in the level of pro-inflammatory cytokines among the nicotine group, myocarditis group and methyllycaconitine group. &P < 0.05 versus the myocarditis group and #P < 0.05 versus the methyllycaconitine group.
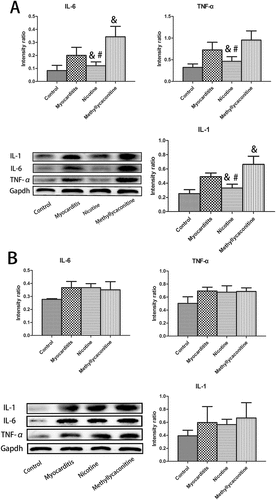
Figure 6. Expression of specific transcription factors and cytokines for Th cell subsets in the heart on day 7 (n = 5 in each group). The levels of IFN-γ, IL-17, T-bet and ROR-γ were lower in the nicotine group than in the myocarditis group. Otherwise, the levels of GATA3, Foxp3 and IL-4 were higher in the nicotine group than in the myocarditis group. A is the absolute intensity ratio of the cytokines for the Th cell subset. B is the absolute intensity ratio of the specific transcription factors. &P < 0.05 versus the myocarditis group and #P < 0.05 versus the methyllycaconitine group.
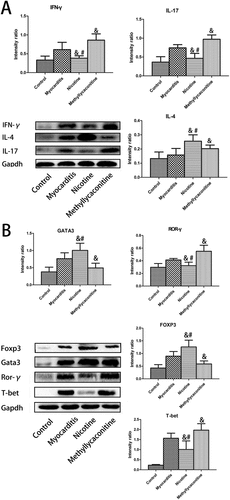
Figure 7. Expression of specific transcription factors and cytokines of the Th cell subset in the heart on day 14 (n = 5 in each group). There was no significant difference between the treatment and myocarditis groups. A is the absolute intensity ratio of cytokines for the Th cell subset. B is the absolute intensity ratio of the specific transcription factors. &P < 0.05 versus the myocarditis group and #P < 0.05 versus the methyllycaconitine group.
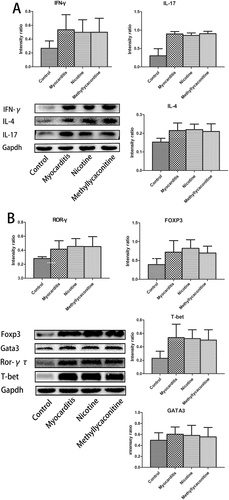
Figure 8. The percentages of Th subsets in the spleen (n = 5 in each group). On day 7, the percentages of Th1 and Th17 cells were deceased, while the percentages of Th2 and Treg cells were increased in the nicotine group. &P < 0.05 versus the myocarditis group and #P < 0.05 versus the methyllycaconitine group.