Figures & data
Table 1. Exploratory study, lower respiratory tract GAS infection in presence or absence of trauma: muscle data.
Table 2. Exploratory study, lower respiratory tract GAS infection in presence or absence of trauma: systemic tissue data.
Figure 1. Diagram showing timing of contusion – infection model for exploratory studies.
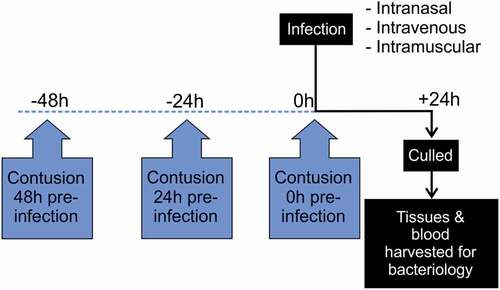
Table 3. Exploratory study, intravenous infection in presence and absence of trauma: muscle data.
Table 4. Exploratory study, intravenous infection in presence and absence of trauma: systemic tissue data.
Figure 2. Histological features in soft tissue with or without contusion.
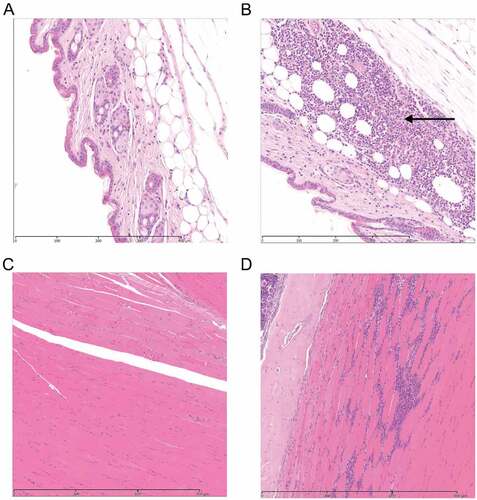
Figure 3. Histological features in soft tissue are similar following infection without or with contusion.
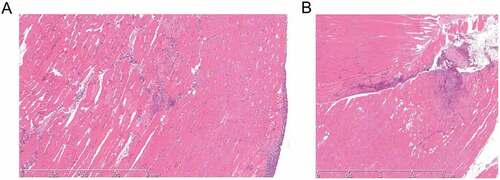
Figure 4. Quantification of GAS in different tissues following simultaneous contusion and local intramuscular GAS infection.
Figure 5. Emergence of hasABC promoter deletion variants during GAS infection in draining inguinal lymph node.
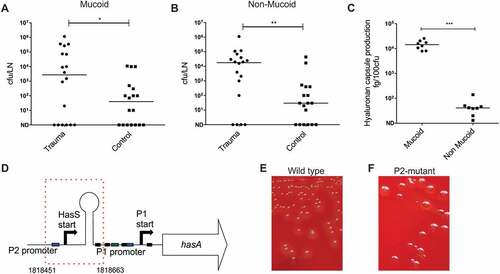
Figure 6. Impact of capsule promoter mutation on GASin ipsilateral lymph node.