
Figures & data
Figure 1. Clinical description of a patient undergoing antibiotic treatment.
A. The history of antibiotic exposure for a patient admitted into the hospitalThe colored text and bars represent the sources from which the bacterial species were isolated. S-E. coli, sensitive-E. coli; CR-E. coli, Carbapenem-resistant E. coli B. Dynamic alterations of body temperature and leukocyte counts of the patient recorded during the hospitalization period
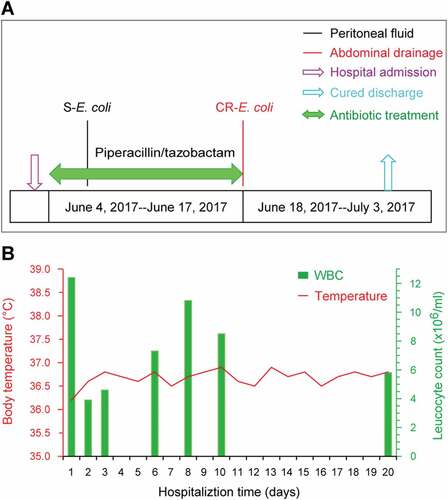
Figure 2. Genomic map of the mcr-1-carrying plasmid pLSB54-mcr-1.
The plasmid map was generated using GenomeVx [Citation28] with automatic coloring.
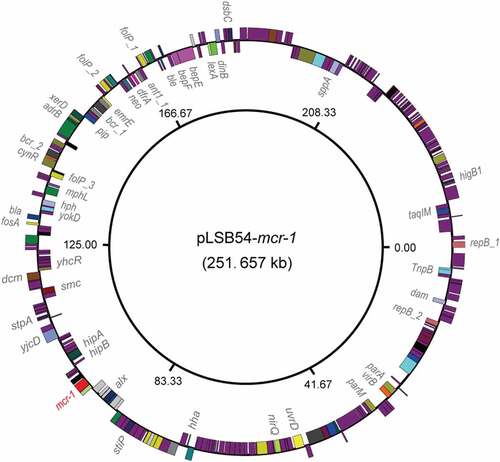
Figure 3. Genomic map of the NDM-5-producing plasmid pLSB54-NDM-5.
The plasmid map was generated using GenomeVx [Citation28] with automatic coloring.
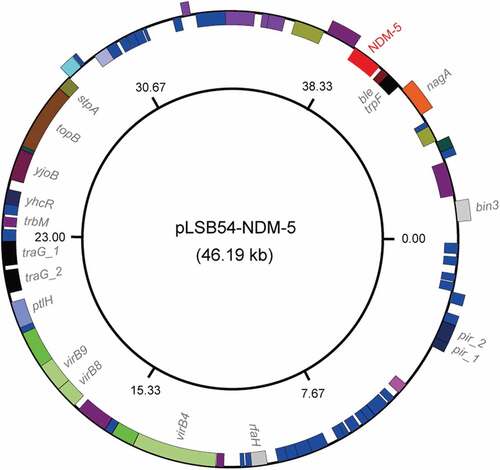
Figure 4. Comparative genomics of pLSB54-mcr-1 and pLSB54-NDM-5.
A. Cartoon description of the E. coli LSB54 strain carrying the two plasmids pLSB54-mcr-1 and pLSB54-NDM-5B. Colinear genome analyzes of three mcr-1-harboring plasmids pLSB54-mcr-1, pHNSHP45-2 (KU341381) and p2474-MCR1 (CP021209)C. Genomic comparison of the plasmid pLSB54-NDM-5 with two other NDM-5-expressing plasmids pCREC-591_4 (CP024825) and pNDM_MGR194 (KF220657)Boxed arrows represent the position and transcriptional direction of the ORFs. Regions of > 99% identity are given by green shading. Genes associated with the tra and pil loci are colored light blue, antibiotic resistance genes are colored red, insertion sequences are colored green, and other genes are colored black.
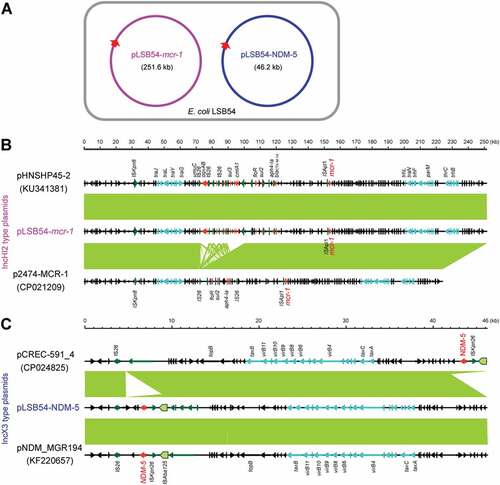
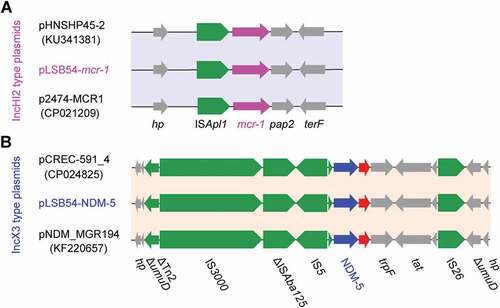
Figure 5. Genetic contents of mcr-1 (and/or blaNDM-5).
A. The genetic environment of mcr-1 and its neighboring lociB. The genetic environment of blaNDM-5 and its neighboring lociThe arrows indicate open reading frames, resistance genes, insertion sequences and accessory genes are separately shown with red, green and gray arrows.
Supplemental material