
Figures & data
Figure 1. Substitution of the 238th Asp with an Arg impaired the hemolytic and pore-forming activity of PLO.
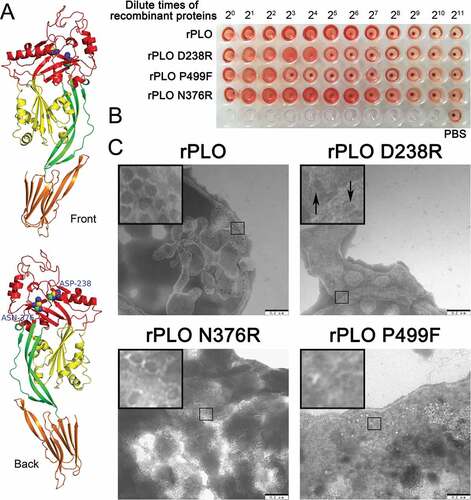
Figure 2. Determination of the cell membrane binding activity of rPLO and mutants by western blot assays.
Figure 3. Determination of oligomers formed by rPLO and rPLO D238R by western blot assays.
Figure 4. rPLO D238R showed decreased cytotoxicity in L929 and MDBK cells. rPLO and rPLO N376R showed evident cytoxicity in L929 cells even at a low concentration of 0.3 μg/mL (A and C). rPLO D238R did not show evident cytotoxicity in L929 cells at 2.5 μg/mL (B). rPLO P499F was more cytotoxic than rPLO D238R given that 2.5 μg/mL of rPLO P499F evidently decreased the viability of L929 cells (D). Compared with L929 cells, MDBK cells were less sensitive to the cytotoxicity of rPLO and rPLO N376R. rPLO and rPLO N376R showed evident cytotoxic effects in MDBK cells at 1.25 and 0.6125 μg/mL, respectively (E and G). rPLO D238R at 2.5 μg/mL was cytotoxic in MDBK cells (F). rPLO P499F showed cytotoxicity in MDBK cells only when concentration exceeded 5 μg/mL (H).
Figure 5. Profile of the expression of inflammation-associated cytokines in L929 cells treated by recombinant proteins.
Figure 6. Images and histopathologizal analysis of tissue damage caused by different recombinant proteins in mice.
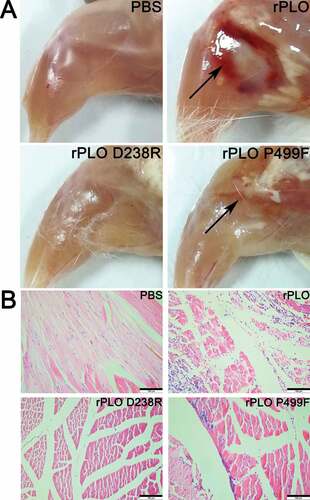
Figure 7. Expression levels of inflammation-associated cytokines in mice inoculated with recombinant proteins.
Figure 8. Expression levels of IL-1β and IL-10 in BMDMs treated with rPLO or its mutants at sublytic concentrations.
Table 1. Sequence of the PCR primers for constructing the mutants of plo gene.