
Figures & data
Figure 1. Growth phenotype of different Aspergillus strains on different Cu concentrations. 2000 spores of indicated Aspergillus strains grown on solidified GMM under indicated Cu concentrations for 72 h at 37°C.
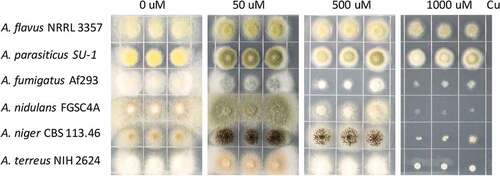
Figure 2. Phylogenetic analysis of heavy metal ATPases (HMA). The phylogenetic tree based on the available HMA sequences from Aspergillus sequences available through NCBI was constructed by MAFFT and Fasttree using the Neighbour-joining method as described in Material and Methods. Bootstrap analysis was performed with 1000 replicates. Aspergillus flavus proteins are shown in red, A. fumigatus in green, A. parasiticus in orange, and A. nidulans in green.
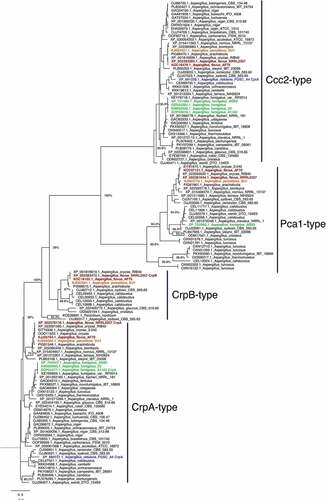
Figure 3. crpA and crpB were induced by Cu and were redundant in Cu detoxification. (A) Northern blot analysis of crpA and crpB in A. flavus wild-type strain. The wild-type strain was grown in liquid GMM without Cu for 24 h at 37°C and then mycelium mass was divided in half where one-half was grown in medium with no Cu and one-half was grown in 200 μM Cu for 1 h before harvesting. rRNA visualization is loaded as control. (B) Growth assay of A. flavus crp mutants on solidified GMM for 72 h at 37°C under indicated Cu concentrations.
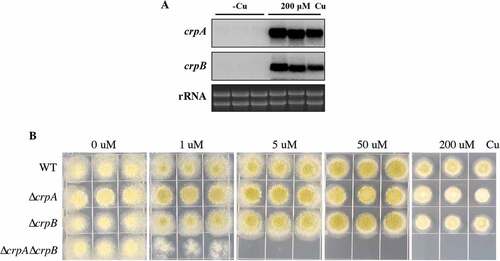
Figure 4. Functional analysis of AceA and its regulation on crpA and crpB. (A) Growth assay of ΔaceA and aceAC mutants on solidified GMM for 72 h at 37°C under indicated Cu concentrations. (B) Northern blot analysis of crpA and crpB in A. flavus wild-type strain. The wild-type strain grown in liquid GMM without Cu for 24 h at 37°C, then to one-half of the cultures, Cu was added to a final concentration of 200 μM for 1 h before harvesting. rRNA visualization is loaded as control. (C) Phenotypic analysis of the strains on solidified GMM under the indicated Cu concentrations for 48 h at 37°C. (D) Total Cu amount from A. flavus mycelia. All strains (5 × 10⁶ conidia/L) were incubated in 50 mL of liquid GMM without Cu in four replicates at 37°C and 200 rpm shaking for 12h. To one-half of the cultures, Cu was added to a final concentration of 50 μM for 12 h before harvesting. Error bars represent standard deviations, asterisk “*, “**” or “***” represent significant differences at p < 0.05, p < 0.01 and p < 0.001, respectively, according to t-test.
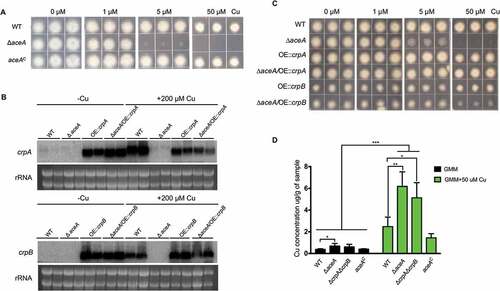
Figure 5. ROS stress increases Cu toxicity in ΔaceA and double ΔcrpAΔcrpB mutants. Growth phenotypes of indicated strains on solidified GMM under indicated concentration of Cu plus supplements as indicated for 48 h at 37°C. MEN = menadione, GSH = l-glutathione.
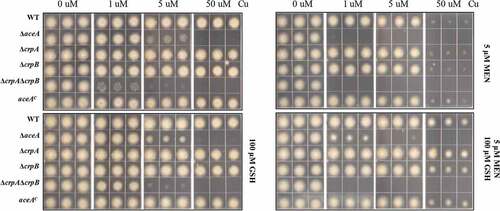
Figure 6. Corn infection with indicated strains. (A) 200 ul of a 106 spore/ml suspension of spores in 0.01% Tween 20 were inoculated on corn and the vials kept in a moist incubator at 29℃ with 12 hours’ light/dark cycling for 5 days. (B) Conidial production assessed from infected maize kernel with and without Cu fungicide treatment. The spores were washed off the seeds with 2.5 mL 100% MeOH and counted. Each sample has four replicates. (C) Aflatoxin extracted from corn and quantified by HPLC. Asterisk “*” or “**” represent significant differences at p < 0.01 and p < 0.001, respectively, according to t-test.
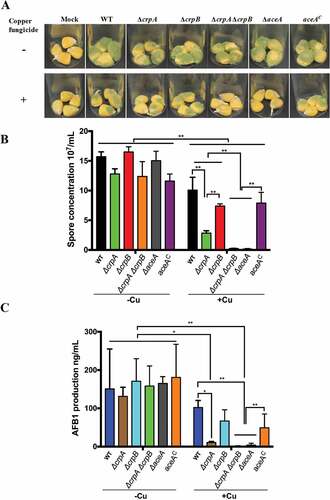
Figure 7. Deletion of A. flavus crpA and crpB results in attenuated virulence in lung-infected immunocompromised mice. (A) Survival rates of ICR mice immunocompromised with cortisone acetate and infected intranasally with 5 × 10⁵ A. flavus WT (n = 19 animals), ΔcrpAΔcrpB (n = 10), ΔaceA (n = 19) or aceAc complemented (n = 8) strains, and survival monitored over 18 days. Virulence was only attenuated in the ΔcrpAΔcrpB strain (p = 0.0004) and not in the ΔaceA strain (p = 0.56). (B) Colony forming unit (CFU) of wild type and copper mutants from infected mice lungs. (C) Histopathology of infected mice lungs stained with Grocott’s methenamine silver stain (GMS; fungal staining) and hematoxylin and eosin (H&E; tissue and nuclear staining). Bar = 200 µm.
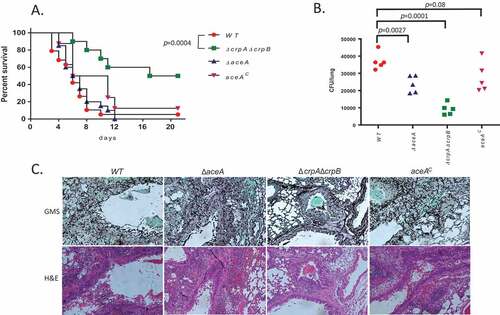
Table 1. Aspergillus strains used in this study.