Figures & data
Figure 1. The homology of TdEno with ENO1 and mEno1. (a) The amino acid sequences of ENO1, mEno1, and TdEno were aligned. Compared with ENO1, identical and conserved amino acids are highlighted in dark and light grey, respectively. B cell epitopes predicted using the Emini Surface Accessibility Prediction method in each protein were marked with red squares. The epitopes of ENO1 and TdEno located at the overlapping regions of aligned sequences are labeled from E1 to E7. (b) The seven epitopes are highlighted in yellow at the known structure (PDB 3B97) of ENO1 (left panel). To confirm the reliability of structure homology modeling, the structure of ENO1 was constructed at the SWISS-MODEL server using the PDB 3B97 as a template (middle panel). The structure homology of TdEno with ENO1 is shown in the right panel.
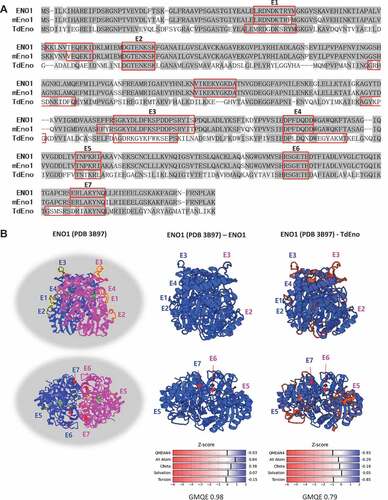
Table 1. Periodontal parameters of non-RA human subjects with slight or moderate periodontitis.
Figure 2. The cross-reactivity of anti-TdEno antibodies with ENO1 in human subjects (a) Concentrations of anti-TdEno and anti-ENO1 IgG antibodies in sera from subjects with slight (sPD) or moderate (mPD) chronic periodontitis were determined by ELISA. (b) Spearman’s correlation between the levels of anti-TdEno and anti-ENO1 antibodies is shown. (c) Various amounts of recombinant TdEno and ENO1 proteins, the lysate and culture supernatant of T. denticola, and the lysates of human cell lines (THP-1 and HOK-16B) were subjected to dot blotting using anti-TdEno antibodies that were affinity-purified from the pooled sera.
Figure 3. The effect of TdEno-induced anti-mEno1 antibodies on the progression of periodontitis in mice (a) The experimental scheme is shown. (b) Concentrations of anti-TdEno, anti-mEno1, and anti-ENO1 IgG antibodies in mouse sera were determined by ELISA. (c) Spearman’s correlation between the levels of anti-TdEno and either anti-mEno1 or anti-ENO1 antibodies is shown. (d) Images of the maxillary first molar of a representative mouse from each group are shown. Distances between the cemento-enamel junction (CEJ) and alveolar bone crest (ABC) at four lingual sites per the first molar were measured (left panel). The mean value for each mouse was graphed (right panel). The horizontal line presents the mean of each group. *p < 0.05 and **p < 0.005, compared to sham, †p < 0.0001, compared to Pg, and ǂp < 0.05 and ǂǂp < 0.05, compared to TdEno.
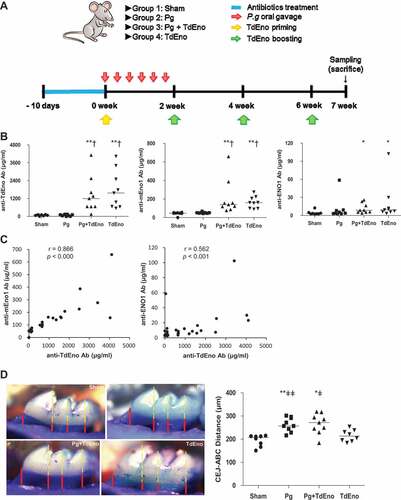
Figure 4. Expression of inflammatory cytokines in the gingival tissues (a) Expression levels of TNFα and IL-1β mRNA in the gingival tissues were measured by real-time PCR. *p < 0.05 and **p < 0.005, compared to sham. (b) Spearman’s correlations between TNFα and alveolar bone loss, anti-mEno1 antibodies and TNFα or alveolar bone loss are shown.