Figures & data
Figure 1. The geographic location of the China-Myanmar border region and sample sites. The black line with a blue shadow shows the border between China and Myanmar; the red and black spots indicate sample sites in China and their border regions in Myanmar, respectively; and the yellow triangle indicates the well-known illegal drug production region called the “Golden Triangle.”.
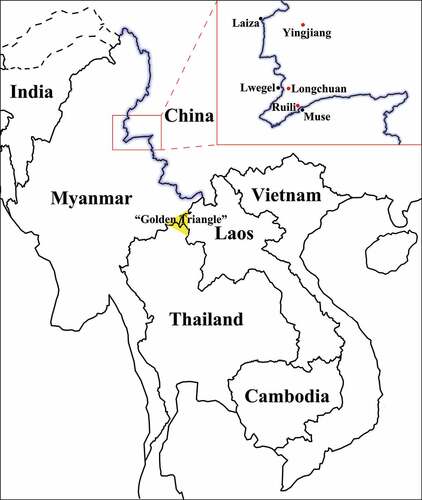
Table 1. The basic data for the samples from Burmese injecting drug users in Yunnan, China.
Figure 2. Maximum likelihood trees and cluster analysis results for the HIV-1 p17, pol, vif-env and env fragments sampled from Burmese injecting drug users in Yunnan, China. The sectors with different colors indicate different subtypes/recombinant forms of HIV-1; the blue triangles, red spots and purple squares indicate the sequences that were sampled in Longchuan, Yingjiang and Ruili Counties of Dehong Prefecture among Burmese injecting drug users, respectively; the black rhombuses indicate the sequences that were sampled in Longchuan and Ruili Counties of Dehong Prefecture among Chinese injecting drug users; and the brackets with numbers indicate transmission clusters that were identified by Cluster Picker.
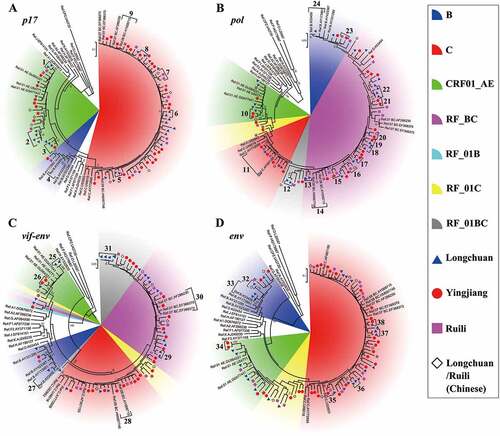
Table 2. Cluster analysis results for HIV-1 fragments sampled from Burmese injecting drug users in Yunnan, China.
Figure 3. The maximum clade credibility tree based on the subtype C and CRF01_AE sequences of the HIV-1 p17 fragment in the China-Myanmar border region. The different colored lines indicate the HIV-1 strains from different geographical locations, and the black spots indicate the nodes of HIV-1 lineages. The state posterior probabilities are indicated beside major nodes, and the ages of nodes A, B and C are shown with 95% confidence interval.
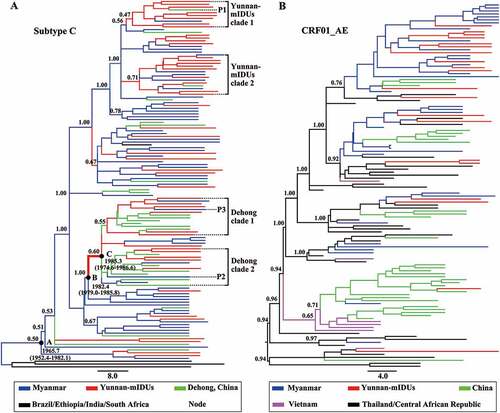
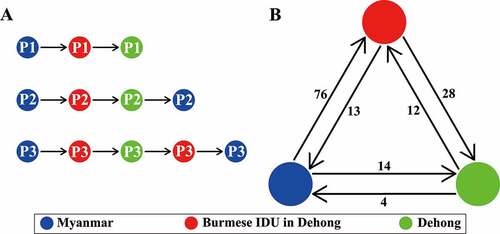
Figure 4. Schematic diagram of HIV-1 transmission patterns and trends in the China-Myanmar border region. The different colored spots indicate the HIV-1 strains from different geographical locations; the arrows indicate the transmitted directions; and the numbers beside them show the routings (a) or sequences (b) of each transmission direction.