Figures & data
Figure 1. Point mutation of the cysteine 195 within the putative catalytic center of rIdeSsuis leads to loss of IgM cleavage activity. Porcine serum was incubated with 5 µg/ml of the indicated rIdeSsuis constructs, followed by anti-pig IgM Western blot analysis with a polyclonal anti-IgM antibody. Serum incubated with phosphate buffered saline served as negative control (-). A 10% percent polyacrylamide gel was used for SDS-PAGE under reducing conditions. Marker bands in kDa are shown on the right-hand side. IgM cleavage products are indicated by asterisks.
Figure 2. In the presence of high S. suis specific IgM titers, complement-mediated hemolysis and labeling of sheep erythrocytes with IgM are significantly reduced by rIdeSsuis constructs with IgM cleaving activity, but not by rIdeSsuis constructs lacking IgM cleavage activity due to the C195S point mutation. Hemolysis assays were performed by addition of purified sheep erythrocytes to pig anti-sheep erythrocyte serum which had been pretreated with either different concentrations of rIdeSsuis and rIdeSsuis_C195S (a) or different recombinant IdeSsuis constructs (b). The assays were performed with porcine serum drawn seven days after immunization with sheep erythrocytes (n = 4). Bars and error bars represent mean and standard deviation and significant differences are indicated. (a) Hemolysis induced by water was defined as one hundred percent and is represented by the first bar. (b) rIdeSsuis wt, rIdeSsuis_C195S, rIdeSsuis_homologue, rIdeSsuis_homologue_C195S, rIdeSsuis_C_domain, rMrp were compared regarding their ability to reduce complement mediated hemolysis at 18 µg/ml. Recombinant Mrp served as a control protein and was purified the same way as rIdeSsuis constructs. Post immunization serum without either rIdeSsuis construct served as negative control. (c) Flow cytometric analysis of IgM labeled sheep erythrocytes was performed after addition of purified sheep erythrocytes to a heat inactivated porcine anti-sheep erythrocyte serum drawn seven days after immunization and pretreated with 18 µg/ml of the indicated rIdeSsuis constructs. Serum drawn prior to immunization with sheep erythrocytes served as negative control. Serum drawn seven days post immunization served as positive control. Bars and error bars show mean values and standard deviations (n = 6). Significant differences are indicated by asterisks. Probabilities were considered as follows p < 0.05 *, p < 0.01 **, p < 0.001 ***.
Figure 3. IgM proteolysis by rIdeSsuis and rIdeSsuis_homologue promotes survival of S. suis 10∆ideSsuis in porcine blood. (a) Blood survival assay in whole porcine blood of growing piglets with high specific anti-S. suis IgM antibody titers. S. suis 10∆ideSsuis was supplemented with 0.2, 2, 20 µg rIdeSsuis or 20 µg rIdeSsuis_C195S (n = 8) per ml blood. The survival factor of S. suis strain 10 and the isogenic deletion mutant 10∆ideSsuis in porcine blood with the addition of rIdeSsuis and rIdeSsuis_C195S after a two-hour incubation period at 37°C is depicted. Bars and error bars represent means and standard deviations. Significant differences are indicated. Probabilities were considered as follows p < 0.05 *, p < 0.01 **, p < 0.001 ***. (b) Anti-IgM Western blot analysis of plasma after the blood survival assay shown in ). IgM cleavage products were detectable in plasma after a blood survival assay including 2 and 20 µg rIdeSsuis and as faint bands in association with incomplete cleavage also for 0.2 µg rIdeSsuis. Marker bands in kDa are shown on the left-hand side. Asterisks indicate IgM cleavage products for the first positive lane. (c) Blood survival assay of S. suis 10∆ideSsuis in whole porcine blood of growing piglets (n = 6). S. suis 10∆ideSsuis was supplemented with 20 µg rIdeSsuis_homologue or rIdeSsuis_homologue_C195S per ml blood (n = 6). Survival factors were calculated and are depicted analogously to Fig. (A).
Figure 4. S. suis strain 10 (wt) and the complemented mutant 10∆ideSsuis∇ideSsuis_EcoRI (∇ideSsuis_EcoRI) cleave porcine IgM (a) and reduce bacterial IgM labeling by over 90% (B,C), in contrast to 10∆ideSsuis (∆ideSsuis) and the point mutated mutant 10∆ideSsuis∇ideSsuis_C195S (∇ideSsuis_C195S). (a) Twenty-four-fold concentrated supernatants of the respective strains were incubated with 1:100 diluted porcine serum, followed by anti-porcine IgM Western Blot analysis under reducing conditions. Incubation of serum with phosphate-buffered saline was used as negative control (-). An 8% separating gel was used for gel electrophoresis and a polyclonal anti-IgM antibody for detection of IgM. Marker bands in kDa are shown on the left-hand side. Asterisks indicate IgM cleavage products on the left side of the first positive lane. (b, c) The indicated S. suis strains were grown to an OD600 of 0.8, incubated in anti-S. suis serotype 2 hyperimmune serum for 0.5 hours at 4°C and then for four hours at 37°C. IgM labeling of the bacterial surface was analyzed before and after incubation at 37°C by flow cytometry (n = 6) (b) and fluorescent microscopy (c) using a monoclonal anti-IgM antibody and a phycoerythrin (PE)-labeled secondary antibody. The % reduction in IgM labeling was calculated by subtracting the percental amount of IgM positive bacteria after a four-hour incubation period at 37°C from an initially one hundred percent positive population before incubation at 37°C. (c) DAPI (4ʹ,6 diamidino-2-phenylindole) dye in blue was used to stain DNA. IgM, labeled by the monoclonal anti IgM antibody and the PE-labeled secondary antibody appears in pink. Bars and error bars indicate mean and standard deviation. Significant differences are indicated by asterisks. Probabilities were considered as follows p < 0.05 *, p < 0.01 **, p < 0.001 ***.
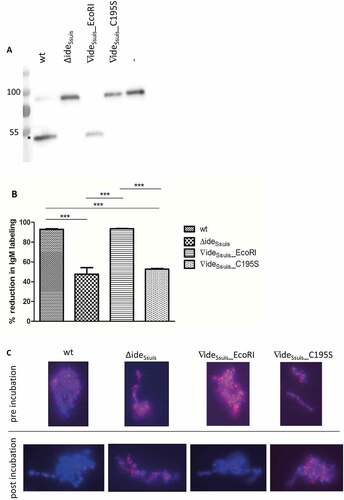
Figure 5. IgM cleavage by IdeSsuis reduces surface bound F(ab‘)2 and Fc antigen of porcine IgM. S. suis strain 10 (wt), 10∆ideSsuis (∆ideSsuis), 10∆ideSsuis∇ideSsuis_EcoRI (∇ideSsuis_EcoRI), 10∆ideSsuis∇ideSsuis_C195S (∇ideSsuis_C195S) were incubated in a porcine anti-S. suis serotype 2 hyperimmune serum for 0.5 hours at 4°C and then for four hours at 37°C. Bacteria were stained with IgM F(ab‘)2 and IgM Fc specific antibodies and measured by flow cytometry (n = 7) before and after incubation at 37°C. (a) Reduction of the percentage of IgM Fc positive bacteria. (b) Reduction of the geometric mean fluorescence intensity (MFI) of the IgM Fc signal. (c) Reduction of the percentage of IgM F(ab‘)2 positive bacteria. (d) Reduction of the geometric mean fluorescence intensity (MFI) of the IgM F(ab‘)2 signal. The reduction in IgM labeling was calculated by subtracting the percental amount or MFI of IgM positive bacteria after a four-hour incubation period at 37°C from an initially one hundred percent positive population before incubation at 37°C. Bars and error bars indicate mean and standard deviation. Asterisks indicate significant differences. Probabilities were considered as follows p < 0.05 *, p < 0.01 **, p < 0.001 ***.
Figure 6. IgM cleavage activity by rIdeSsuis leads to reduction of C3 antigen on the bacterial surface. S. suis strain 10 (wt), 10∆ideSsuis (∆ideSsuis), 10∆ideSsuis∇ideSsuis_EcoRI (∇ideSsuis_EcoRI), 10∆ideSsuis∇ideSsuis_C195S (∇ideSsuis_C195S) were incubated in a 1:2 diluted IgG depleted porcine anti-S. suis serotype 2 hyperimmune serum. After incubation at 37°C, bacteria were stained with a FITC-labeled rabbit anti-human C3c antibody and measured by flow cytometry. S. suis strain 10 incubated in undiluted serum served as positive control (+ ctrl). S. suis strain 10 incubated with heat-inactivated serum served as negative control (- ctrl). Bars and error bars represent mean and standard deviation. Significant differences are indicated by asterisks. Probabilities were considered as follows p < 0.05 *, p < 0.01 **, p < 0.001 ***.
Figure 7. Survival of S. suis serotype 2 in porcine blood is restricted by active complement. (a) Survival of S. suis strain 10 (wt), 10∆ideSsuis (∆ideSsuis) and the two complemented strains 10∆ideSsuis∇ideSsuis_EcoRI (∇ideSsuis_EcoRI) and 10∆ideSsuis∇ideSsuis_C195S (∇ideSsuis_C195S) was analyzed in a whole blood survival assay with the addition of the complement inhibitor vaccinia virus complement control protein (VCP). Porcine whole blood from growing piglets (n = 6) with high anti-S. suis IgM titers was pre-incubated with 0.4, 4, 20 µg VCP/ml for five minutes at 37°C. 4 × 10⁶ CFU/ml of the indicated S. suis strains were then added and the survival factor determined by plate counting after two hours at 37°C. (b) Soluble C5b-9 was determined in porcine plasma after the blood survival assay by sC5b-9 ELISA. A concentration dependent reduction in sC5b-9 levels was detectable after addition of VCP to porcine whole blood (Pearson r values: wt: −0,9487; 10∆ideSsuis: −0,8485; 10∆ideSsuis∇ideSsuis_EcoRI: −0,9999; 10∆ideSsuis∇ideSsuis_C195S: 0,9821). Bars and error bars indicate mean and standard deviation. Significant differences are indicated by asterisks. Probabilities were considered as follows p < 0.05 *, p < 0.01 **, p < 0.001 ***.
Figure 8. Transmission electron microscopy reveals a different capsule morphology for S. suis 10∆ideSsuis∇ideSsuis_ EcoRI. The expression and thickness of the capsule of S. suis strain 10 (wt), 10∆ideSsuis (∆ideSsuis), 10∆ideSsuis∇ideSsuis_C195S (∇ideSsuis_C195S) and ∆ideSsuis∇ideSsuis_EcoRI (∇ideSsuis_EcoRI) was investigated by transmission electron microscopy using lysine-ruthenium red staining. The morphology of the capsule of the complemented S. suis mutant ∇ideSsuis_EcoRI differs from that of the other strains in that it appears less dense and significantly thinner.
Table 1. Histopathological scoring of fibrinosuppurative lesions of growing piglets challenged with the indicated S. suis strains.
Table 2. Reisolation of the infection strains from piglets infected with the indicated S.suis strains.
Figure 9. Mortality (a) and morbidity (b) of growing piglets experimentally infected with the indicated S. suis strains. Eight-week old piglets were infected with S. suis strain 10 (wt), 10∆ideSsuis (∆ideSsuis), 10∆ideSsuis∇ideSsuis_EcoRI (∇ideSsuis_EcoRI), 10∆ideSsuis∇ideSsuis_C195S (∇ideSsuis_C195S). Morbidity was defined as an inner body temperature equal to or greater than 40.2°C and/or typical clinical signs of S. suis disease such as acute lameness or convulsions. Statistical analysis of the Kaplan-Meier diagrams was performed using the log-rank test. P-values are shown below the diagrams.
Figure 10. IgM Western blot analysis of cerebrospinal fluid (CSF) of experimentally infected piglets with acute meningitis and high intracerebrospinal S. suis burden reveals only intact IgM. Piglets were intranasally infected with the indicated strains and the CSF of one pig with meningitis of each infection group was analyzed for the presence of IgM cleavage products by anti-IgM Western Blot analysis under non-reducing conditions with a monoclonal anti-IgM antibody. Protein concentrations in the CSF were adjusted before loading the 6% polyacrylamide gel. As a control (lanes 7–10), CSF of the same piglets was incubated with 5 µg/ml rIdeSsuis. Asterisks indicate IgM cleavage products for the last positive lane. Marker bands (in kDa) are shown on the left-hand side.
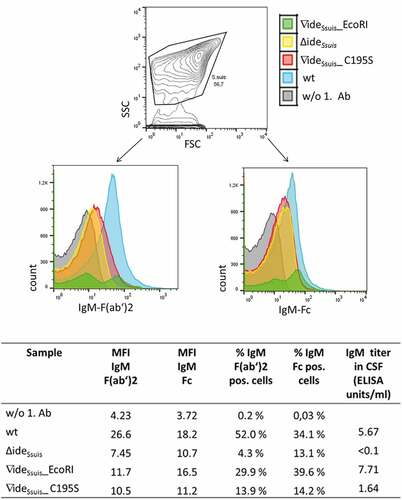
Figure 11. S. suis in the CSF of experimentally infected piglets is labeled with porcine IgM. Eight-week old piglets were intranasally infected with S. suis strain 10 (wt), 10∆ideSsuis (∆ideSsuis), 10∆ideSsuis∇ideSsuis_EcoRI (∇ideSsuis_EcoRI) and 10∆ideSsuis∇ideSsuis_C195S (∇ideSsuis_C195S), respectively. The CSF of one pig with meningitis of each infection group was centrifuged and the intracerebrospinal S. suis population stained with anti-IgM F(ab’)2 and anti-IgM Fc specific primary antibodies and phycoerythrin (PE) and fluorescein (FITC) labeled secondary antibodies. Bacteria were analyzed for the presence of IgM on their surface via flow cytometry. S. suis stained without the first antibodies served as negative control (w/o 1. Ab). The upper panel shows the gating strategy used to define the S. suis population. The lower panels shows the S. suis population in the CSF of infected piglets as overlay histograms of the F(ab’)2 signals (left hand side) and the Fc signals (right hand side). The table beneath the figure shows the geometric mean fluorescence intensity (MFI), the percentage of IgM F(ab’)2 and IgM Fc positive bacteria and the IgM titers of the four representative piglets.