Figures & data
Figure 1. emHofQ Interacts with Cytokines. (A) Binding of cytokines by emHofQ was determined with ELISA. Data are presented as percentage of binding to control protein BSA. Binding of emHofQ to IL-8 was significantly higher than that to BSA (p-value 0.029, Mann-Whitney U-test); N = 4. (B) Interaction with IL-8 and IL-1β was measured with varying emHofQ concentrations using TRFIA. Dissociation constants were calculated for the binding curves: 43 ± 4 nM (emHofQ-IL-8) and 140 ± 20 nM (emHofQ-IL-1β). Data were obtained from three independent experiments and are presented as the mean± SD. BSA was used as a negative binding control. (C) Binding of IL-8 to immobilized emHofQ at different IL-8 concentrations was determined by surface plasmon resonance. The dissociation constant was estimated from the binding curves as being 2.4 ± 1.3 μM. Three independent experiments were performed; one representative image is shown as the primary figure, and the two other images are shown as insets. (D) In the thermal shift assay, the melting temperature (Tm) of emHofQ (45.3°C) increased when emHofQ and IL-8 were co-incubated. At the highest tested IL-8 concentration of 200 μM, the Tm obtained was 51.7°C; N = 4–6. (E) In contrast, the Tm of IL-1β (60.2°C) decreased when IL-1β was incubated with emHofQ. With 50 μM emHofQ, the Tm obtained was 55.8°C; N = 3–4.
Figure 2. The type I KH domain of emHofQ interacted with IL-8. (A) Homodimeric structure of emHofQ (PDB: 2Y3M). Monomer A is colored blue-red from the N terminus to the C terminus, and monomer B is in gray. K139, which involved in the IL-8 interaction, and as the secondary structure elements β5 and α3, which are located next to the interacting loop, are indicated. (B) A total of five mutations were made in two loops (L1 and L2) in the type I KH domain of emHofQ: L1 (H136A, F137A, K139A) and L2 (D165A, R166A). (C) Mutated emHofQ variants bound to IL-8 and IL-1β with lower affinity than the wild-type emHofQ. BSA was used as a negative binding control (smaller graph). Data were obtained from three independent experiments and are presented as the mean± SD. Dissociation constants (Kd) and values of maximum binding (Bmax) for each variant are listed in the table. (D) Structural comparison of the C-terminal type I KH domain of emHofQ (residues 126–191, in gray) with the N1-domain of NmPilQ (residues 439–516 (PDB id: 4AV2), in blue).
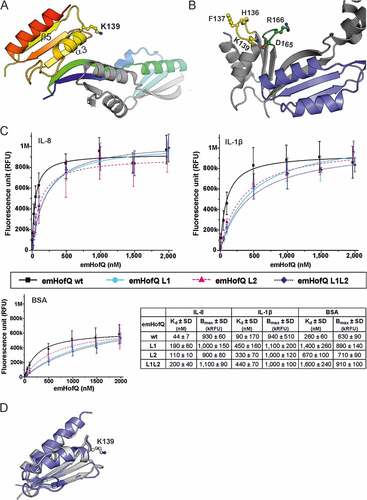
Figure 3. Recombinant IL-8 interacted with linear dsDNA. Linear A. actinomycetemcomitans USS DNA (31 μg/ml) was incubated with varying amounts of IL-8 for 30 min at RT and run on a 0.8% agarose gel (EMSA). Interaction between the DNA and IL-8 was observed with high IL-8 amounts as the formed complexes were trapped in the wells. BSA (10 mg/ml) was used as a negative control.
Figure 4. Verification of the ΔhofQ mutant and expression of hofQ from the com locus. (A) Deletion of the hofQ gene from A. actinomycetemcomitans D7S was verified by extracting the genomic DNA and performing PCR with flanking primers. The deletion was further verified at the transcriptional level by extracting RNA and performing reverse transcription -PCR. No hofQ gDNA or cDNA was observed in the A. actinomycetemcomitans ΔhofQ mutant. In addition, in the D7S wild-type strain, hofQ was transcribed at a higher level in minimal (RPMI) medium than in rich (TSB) culture medium. The control gene clpX was expressed and transcribed at the same level in both strains and culture conditions. (B) Genetic organization of the com locus in A. actinomycetemcomitans D7S. DNA in the com locus is marked with dark arrows, and additional ORFs outside the com locus are noted with gray arrows. Small black arrows indicate the locations of the primers (numbered) used for operon characterization. (C) Neither the gene locus from comA to shiKi nor that from comA to hofQ was detected as a single transcription unit, even in wild-type D7S, indicating that these genes are organized in different operons. However, the comD and hofQ genes were co-transcribed in wild-type D7S but were absent in the ΔhofQ strain. In wild-type A. actinomycetemcomitans, the comD-hofQ operon was transcribed more in minimal culture medium (RPMI) than in rich culture medium. Primers used for operon characterization are indicated by their names and numbers (listed in ) next to each panel.
Figure 5. Deletion of hofQ increased the antimicrobial susceptibility of A. actinomycetemcomitans to β-lactams. Deletion of the hofQ gene made A. actinomycetemcomitans more susceptible to ampicillin (amp, p = 0.001) and amoxicillin/clavulanic acid (amc, p = 0.001) but did not significantly alter the susceptibility to tetracycline (tet, p = 0.093) or doxycycline (dox, p = 0.485). MIC values were determined from the scale on the Etest® strip after 45–48 h of incubation. Data were obtained from 5–9 independent experiments and are presented as the mean± SD.
Figure 6. emHofQ was not antigenic in A. actinomycetemcomitans-positive periodontitis patients, and HofQ did not enhance the production of ROS by leukocytes when stimulated with A. actinomycetemcomitans cells. (A) Compared with the wild-type strain, the hofQ deletion did not significantly affect the production of ROS by leukocytes (p = 0.442). ROS production was measured as chemiluminescence, and the peak values obtained for the wild-type and ΔhofQ mutant A. actinomycetemcomitans strains were compared. Bacteria were pretreated with plasma collected from a healthy individual, and leukocytes were freshly isolated from the plasma of healthy control subjects (N = 8). (B) Opsonization efficiency of the sera collected from A. actinomycetemcomitans-positive patients was higher than that of the healthy control sera, but these sera significantly only enhanced the production of ROS by leukocytes when the ΔhofQ mutant was used (p = 0.005). Peak values of the chemiluminescence reactions are reported for 12 patient sera and 12 control sera. The horizontal lines indicate the mean values of each sample set; N = 1–3. (C) Sera collected from A. actinomycetemcomitans-positive patients did not have higher emHofQ antibody levels than sera from healthy control subjects when tested with ELISA. A total of 12 patient sera and 12 control sera were tested. Data corresponding to nonspecific binding to the negative control (BSA) was subtracted from the data obtained for emHofQ binding.
Table 1. Formation and composition of A. actinomycetemcomitans D7S ΔhofQ biofilm compared to that of the wild-type (wt) D7S strain.
Table 2. Effect of hofQ deletion on the biofilm response to cytokines IL-1β and IL-8, measured as changes in biofilm composition.
Table 3. Codon-optimized genes for protein expression. Restriction enzyme binding sites (NdeI and XhoI) are underlined.
Table 4. Primers and annealing temperatures used in this study. Restriction enzyme sites are underlined.
Figure 7. Preparation of the markerless D7S ΔhofQ mutant. Natural transformation and homologous recombination was used to replace hofQ with the recombinant loxP-spe-loxP cassette that contained the flanking regions upstream and downstream of hofQ. The transformants (ΔhofQ::spe) were verified by PCR. The loxP-spe-loxP cassette was removed by the pAT-Cre-plasmid (TetR), which was introduced via natural transformation. Cre recombinase then catalyzed the recombination between the loxP sites. The obtained colonies were examined for Spe and Tet resistance, and the colonies sensitive to both antimicrobials had lost both the loxP-spe-loxP cassette and the pAT-Cre plasmid, i.e., these colonies were markerless D7S ΔhofQ mutants.