
Figures & data
Figure 1. Alignment of the LsgB protein among H. parasuis and other genera. (a) Simplified depiction of the lsgB gene and its flanking genes on the H. parasuis SH0165 chromosome. (b) Analysis of LsgB protein homology among different bacterial genera, including M. vargena, P. multocida, A. suis, H. influenzae and H. parasuis using the NCBI BLAST program with the default parameters. Conserved protein sequences are labeled in yellow, and the triangles indicate the conserved motifs of the LsgB sequence.
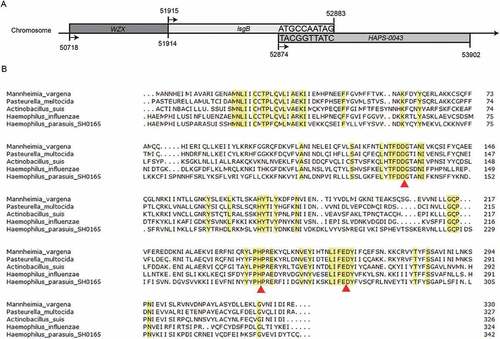
Figure 2. Schematic representation and PCR identification of the lsgB gene deletion and its complementation. (a) The primers for amplification of specific target fragments are labeled. Primer pair P9/P10 was used to detect the inner lsgB gene, P11/P12 was used to amplify the intact lsgB deletion region, and P5/P6 amplified the kanamycin cassette. (b) PCR identification of the inner-lsgB region (513 bp), the intact deletion region of lsgB (969 bp or 1167 bp), and the kanamycin resistance cassette (894 bp).
Figure 3. Effects of lsgB deletion on bacterial growth, morphology, and LOS sialylation. (a-b) Comparison of growth among the wild-type SH0165, ΔlsgB mutant and C-lsgB strains. OD600 values of each strain during growth for 16 h were recorded every 2 h, and viable bacterial counts were calculated at 4 h intervals. (c) Both optical microscopy and scanning electron microscopy were used to observe the morphology of each strain. (d) Schematic depiction of the LOS structure and silver staining of LOS in the wild-type SH0165, ΔlsgB mutant and C-lsgB strains. (e-f) HPLC analysis of LOS sialic acid content in the SH0165, ΔlsgB and C-lsgB strains. The target peak was detected by fluorescence at appropriate time points based on the results from a standard substance (e), and the peak area ratios were compared (f).
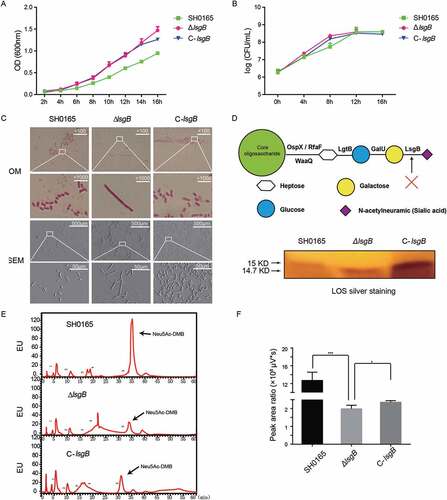
Figure 4. H. parasuis lsgB deletion attenuates bacterial autoagglutination and pathogenicity, and colonization and survival in vivo. (a-b) OD600 values of the upper suspension of each strain were measured and compared every 30 min (a), and the culture suspension after 6 h of static incubation was photographed (b). (c) Virulence test of the wild-type SH0165, ΔlsgB mutant and C-lsgB strains by comparing survival of mice post infection. Each group contained 10 mice, and survival was monitored for 7 days. (d) Bacterial colonization in spleen and lung and survival in the blood were compared in an 8 h challenge assay. Bacterial counts were determined by serial dilution and plating and are expressed as logCFU/mL.
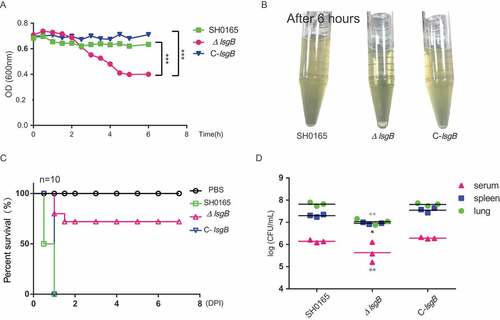
Figure 5. Effects of lsgB deletion in H. parasuis on bacterial adhesion to and invasion of porcine cells. (a-b) Adhesion to and invasion of PIECs by the wild-type SH0165, ΔlsgB mutant and C-lsgB strains. (c-d) Adhesion to and invasion of PK15 cells by the wild-type SH0165, ΔlsgB mutant and C-lsgB strains. (e) Real-time PCR detection of galactose binding receptor, GalR1 and GalR2, expression in response to the three strains. GAPDH was used as the endogenous control. (f) Elevated adhesion to cells by the ΔlsgB mutant was significantly blocked by the addition of galactose. (g) Galactose addition resulted in a dose-dependent inhibition of adhesion by the ΔlsgB mutant.
Figure 6. lsgB deletion increases bacterial sensitivity to serum complement-mediated killing. (a-b) Survival of the wild-type SH0165, ΔlsgB mutant and C-lsgB strains in response to 50% pig serum (a) and 50% mice serum (b). (c) Western blotting analyzing the recruitment of the complement inhibitor, fH, to each strain incubated with or without porcine normal serum (PNS). Both free fH (lower) and bound fH (upper) were all detected. (d) Whole cell ELISA was applied to analyze the bound fH on each strain. The results are presented as the average fluorescence density per bacterium. (e-f) Comparison of C3b or MAC deposition on the surface of the wild-type, ΔlsgB mutant and C-lsgB strains after incubation with PNS and flow cytometry.
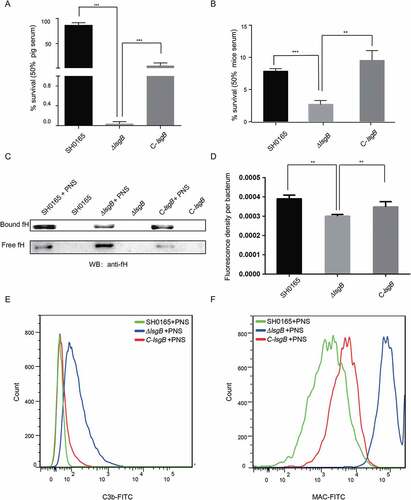
Table 1. Bacterial strains and plasmids used in this study.
Table 2. Sequence of the PCR primers used in this study.