Figures & data
Figure 1. Survival dynamics of 3rd-4th instar Culex quinquefasciatus larvae (n = 30, 10 larvae per replicate) exposed for 7 days to water treated with M. brunneum (isolate ARSEF 4556). Conidia were applied either as dry powder or as a suspension in 0.03% aq. Tween 80, while blastospores were suspended in distilled water. The control treatments were either distilled water or 0.03% aq. Tween 80. Error bars represent ± SE.
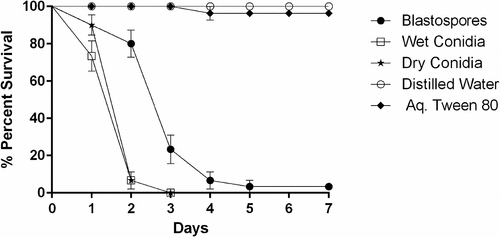
Figure 2. Survival of Culex quinquefasciatus larvae exposed to blastospores (BS) and conidia (C) of M. brunneum in the presence and absence of a protease inhibitor. Cx. quinquefasciatus (n = 72, 24 larvae per replicate) were exposed to M. brunneum blastospores and conidia (107 spores ml−1) with and without the protease inhibitor α2-macroglobulin. Controls consisted of either distilled water or 0.03% aq. Tween 80 with and without the inhibitor. Error bars represent ± SE.
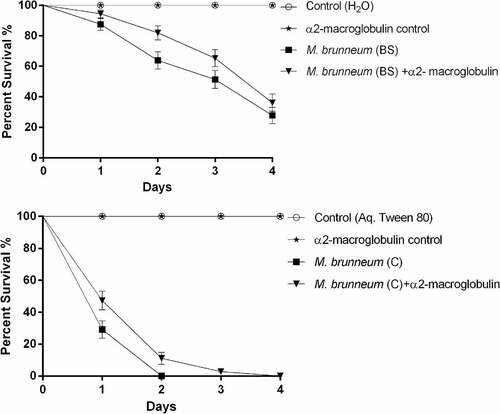
Figure 3. Scanning electron microscopy of Culex quinquefasciatus larvae infected with blastospores (BS) of Metarhizium brunneum ARSEF 4556. Larvae exposed to 107 blastospores ml−1, 48 hr post-inoculation, were examined using Cryo-SEM. (a). Distribution of blastospores on larval cuticle. (b) Some blastospores were found attached to the surface of the head and (c) around mosquito mouthparts. (d) Few blastospores were observed attached to abdominal segments. (e) Cross section of infected larva showing that blastospores of M. brunneum had been ingested by the larvae and occluded the gut lumen (GL). PM: peritrophic membrane, H: haemocoel.
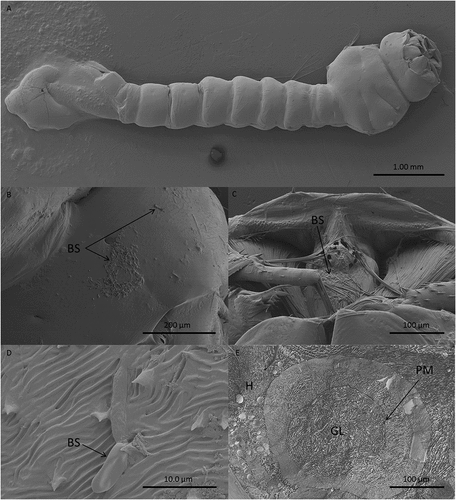
Figure 4. Transmission electron microscopy of interactions between the integument and Metarhizium brunneum ARSEF 4556 blastopsores in the abdominal region of Culex quinquefasciatus larvae 48 hr post-inoculation. (a). Low magnification section showing grouping of blastospores (BS) near the abdominal cuticle (CU). (b). Higher magnification showing a blastospore secreting mucilage (MU) strands in the direction of the host cuticle surface. (c & d). host-pathogen interactions with mucilage forming loose connections with the cuticle surface.
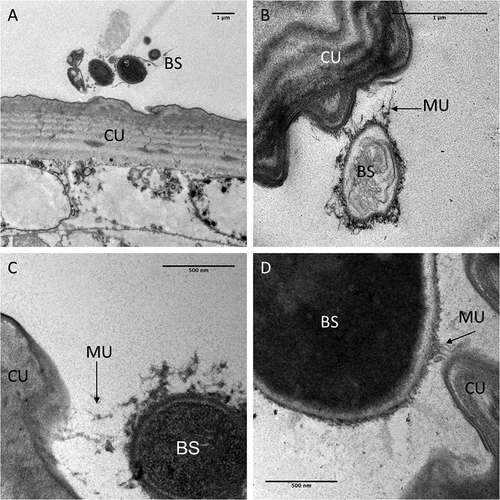
Figure 5. Transmission electron microscopy of Culex quinquefasciatus larval head/thorax region showing defence responses to Metarhizium brunneum ARSEF 4556 blastospore infection, 48 hr post-inoculation. (a). Humoral and cuticular melanisation (ME). Melanization in the haemolymph takes place close to or around circulating blastospores (BS) and beneath integument at sites where blastospores are adhering or attempting to penetrate the cuticle (CU). The cuticle is also melanized at adhesion or putative infection sites. (b). Blastospore penetrating the cuticle and melanisation response to invasion. (c). Increased magnification showing the melanisation response and the possible stress effect on the blastospore integrity (cytoplasm retraction). (d). Intestinal tract showing blastospores near the basal region of the gut epidermis. Gut lumen (GL), cuticle (CU), mucilage (MU), haemocoel (H).
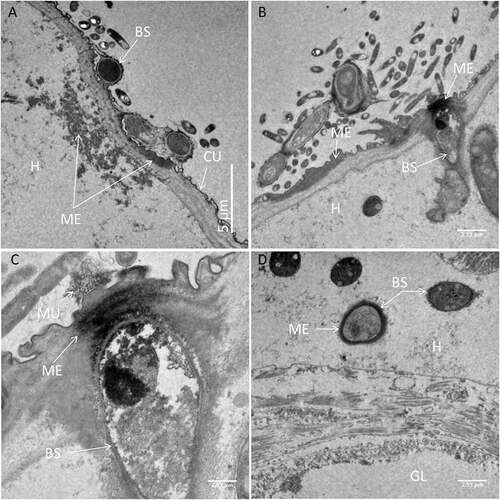
Figure 6. Transmission electron microscopy of Metarhizium brunneum ARSEF 4556 blastospores in gut lumen penetrating gut wall of Culex quinquefasciatus larva, 48 hr post-inoculation. Blastospores (BS), Gut lumen (GL), Peritrophic membrane (PM), Penetration hypha (PH).
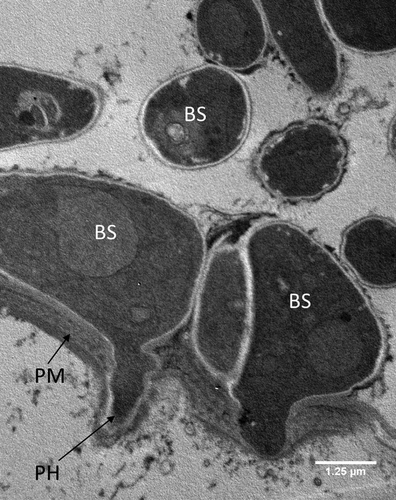
Figure 7. Transmission electron microscopy of Metarhizium brunneum ARSEF 4556 blastospores (BS) in tracheal lumen of Culex quinquefasciatus larva, at 48 hr post-inoculation.
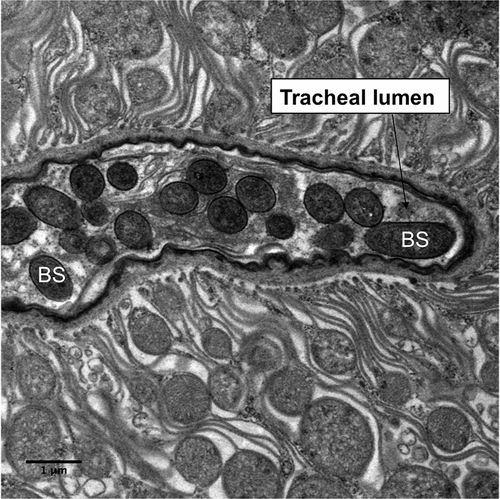
Figure 8. Light microscopy of transverse sections of Culex quinquefasciatus larvae 48 hr post infection with Metarhizium brunneum ARSEF 4556. (A): Blastospores of M. brunneum mostly confined to gut lumen. (B): The blastospores close to the peritrophic membrane are swollen and penetrated the epithelium of midgut to colonize the haemocoel. GL: Gut lumen, PM: peritrophic membrane, BS: Blastospores, H: haemocoel, CU: cuticle surface.
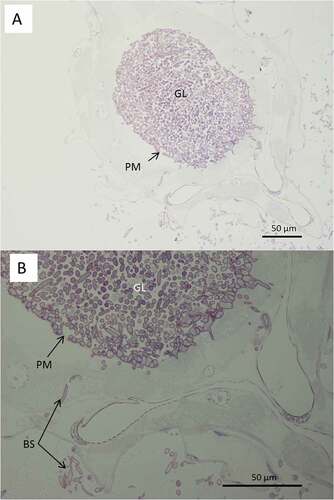
Figure 9. Adhesion forces measured by AFM. The average measured value of adhesion forces between Metarhizium brunneum ARSEF 4556 blastospores and Aedes (AE), Culex (CX) and Tenebrio (TEN) cuticles (n = 100). Significant differences were denoted by different letters, Tukey whisker (25–75 percent quartiles). Boxes denote interquartile range, bisected horizontally by median values; whiskers extend to 1.5× interquartile range beyond boxes; outliers are marked as dots beyond whiskers. Different letters (A, B and C) indicate significant differences between species.
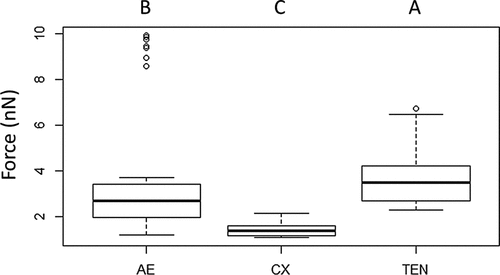
Figure 10. Typical force-distance curves for the interaction of the blastospore probe with larval cuticles of Culex, Aedes and Tenebrio. The highest adhesion forces were recorded for Tenebrio and Aedes, while the lowest were recorded for Culex. The red and blue lines represent the approach and retraction curves, respectively. Initially, the cantilever is away from the sample surface (a) and there is no interaction. It is then moved to the surface (b) or jump to contact point. The cantilever tip remains in contact as the separation between the cantilever and sample decreases, causing a deflection of the cantilever (c). As the cantilever is retracted the tip remains in contact with surface (d), due to adhesion and the cantilever is deflected downwards (e). Eventually, after the adhesion force has been overcome, the tip breaks free and returns a neutral position (f).
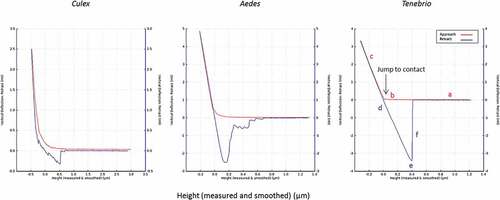
Figure 11. Phenoloxidase (PO) activity in total homogenates of Cx. quinquefasciatus larvae (n = 45, 15 larvae per replicate) at different time points after infection with conidial and blastospore suspensions of M. brunneum (107 spores ml−1). Data presented as mean activity ± SEM. Significant differences are shown at two levels ** p < 0.01, * p < 0.05 when compared to PO activity in non-infected control insects (0 hr).
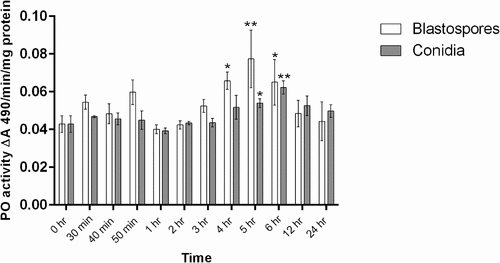
Figure 12. Antioxidant activity in mosquito larvae (n = 12, 3 larvae per replicate) exposed to M. brunneum blastospores (BS) or conidia (C). Activity of glutathione-S-transferase (GST), Superoxide dismutase (SOD), MDA (lipid peroxidase), α-esterase (α-EST) and β-esterase (β-EST) were measured in mosquito larvae exposed to blastospores and conidia. Data presented as means ± SEM. Significant differences are show at three levels ***p < 0.001,**p < 0.01, *p < 0.05. Controls were not exposed to fungal propagules.
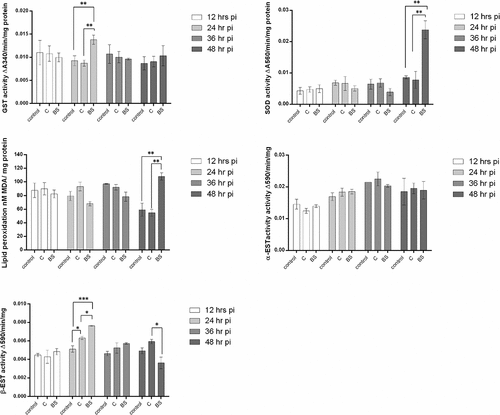
Figure 13. Expression of Metarhizium brunneum (AFSEF 4556) virulence and pathogenicity genes (n = 30, 10 larvae per replicate) . Quantitative PCR was used to analyse expression of pathogenicity related genes in blastospores and conidia of M. brunneum at 24 hr. Genes investigated: adhesins (Mad1, Mad2), proteases (Pr1, Pr2), stress management genes (HSP30, HSP70 and HSP90), an osmosensor (Mos1), G-protein signalling regulator (Cag8) and nitrogen regulator (nrr1). Data was presented as mean (±SEM) means with different letters at the same time point show statistical differences.
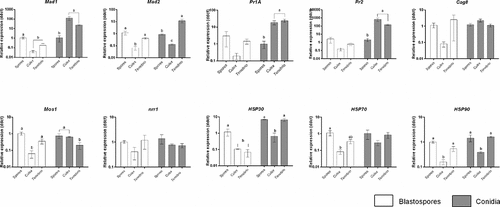
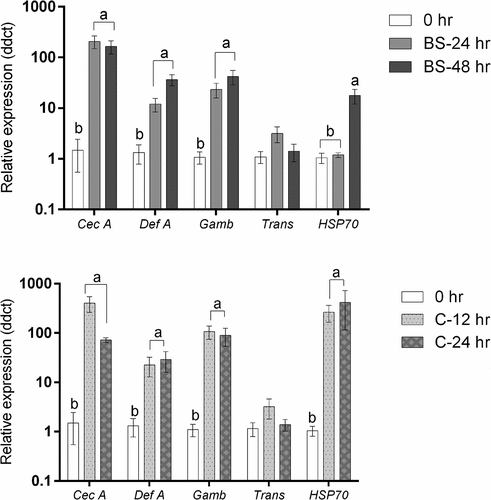
Figure 14. Antimicrobial peptide and stress gene expression in Culex quinquefasciatus larvae (n = 30, 10 larvae per replicate) during infection with Metarhizium brunneum blastospores (BS) or conidia (C). Quantitative PCR was used to analyse AMPs and stress gene expression in Cx. quinquefasciatus larvae inoculated with M. brunneum at 0 hr (uninfected control), 24 hr and 48 hr post-inoculation. Cec A (Cecropin A), Def A (Defensin A), Gamb (Gambicin), Trans (Transferrin) and HSP70 (Heat shock protein 70). Data was presented as means (±SEM). Columns with different letters were statistically different.