Figures & data
Table 1. Antibiotic susceptibility of the bacterial study isolates.
Figure 1. Imipenem Etest for E. cloacae study isolate 1 on Muller Hinton agar with or without cloxacillin.
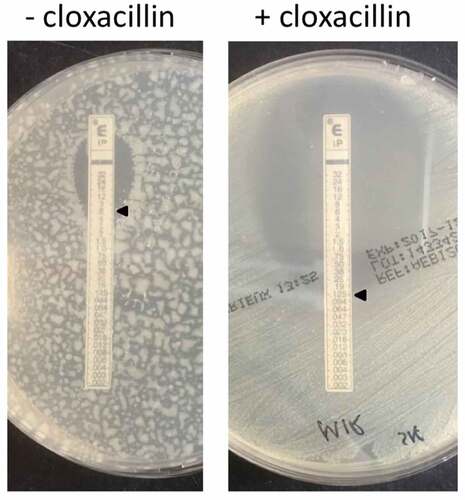
Figure 2. Similarity among MIR17-GI-like MGIs and schematic representation of the P4-like prophage at the 3ʹ end of MIR17-GI. (a) MIR17-GI-like MGIs identified in the four study isolates and E. coli K12 MG1655. The alignment of MIR17-GI-like MGIs was performed with Easyfig (http://mjsull.github.io/Easyfig/). The positions of relevant genes are indicated. (b) Genetic map of the early operon of the P4-like prophage associated with the 3ʹ end of MIR17-GI, following the tRNA-Leu-CAA gene. The relative positions of the genes for the phage integrase, an ATP-ase of unknown function (ATP-ase), the phage polarity suppression protein (psu), the phage capsid and scaffold protein (sid), the Ash family secondary immunity repressor (cI); the DNA replication protein (repA), and the DNA primase are indicated. Numbers correspond to the following gene annotations: 1, late gene regulator; 2, phage DNA binding protein; 3, phage immunity repressor protein; 4, immunity derepression protein; 5, phage protein of unknown function; 6, hypothetical protein for heme transfer during cytochrome c biogenesis.
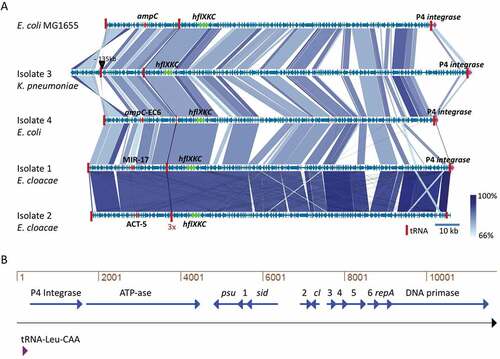
Figure 3. Phylogenetic tree of Citrobacter, Enterobacter, Escherichia, Klebsiella, Salmonella, and Shigella species and conservation of MIR17-GI-like MGIs.
The phylogenetic tree of was created with the Ridom SeqSphere+ software v4.1.9 using a neighbor joining algorithm. It is based on a SNP analysis of 39430 targets of the MGI from the reference genome of the E. coli K12 strain MG1655. The scale bar under the tree represents the phylogenetic distance (in %). The red bars indicate the conservation of the MIR17-GI using the respective MGI of E. coli K12 strain MG1655 as the reference. For the MGI comparisons, an 80% DNA similarity cut-off was used in DNA plotter. The scale bar under the MGI alignment indicates the sequence position of the reference MGI. Bacterial isolates and the respective genome sequence accession codes are presented in Supplemental Table S2.
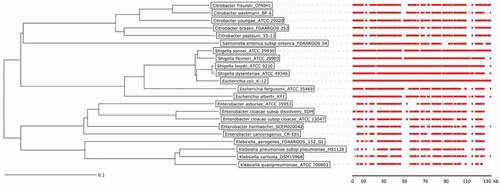
Figure 4. GC content of the MIR17-GI from E. cloacae and the related MGI from E. coli and their flanking regions.
Red bars indicate the position of the respective MGI and blue bars the different flanking regions. The overall GC% per region is indicated and the red-blue diagrams mark variations in the respective GC profiles.
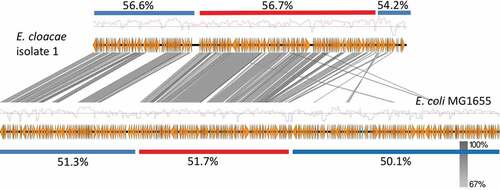
Figure 5. Neighbor joining tree of the ampC genes in Citrobacter, Escherichia, Enterobacter and Shigella species.
The phylogenetic tree of ampC genes in Citrobacter, Escherichia, Enterobacter and Shigella species was created with the Ridom SeqSphere+ software v4.1.9 using a neighbor joining algorithm. The scale bar represents the % difference among 77 nucleotides of ampC, using the ampC gene of the E. coli K12 strain MG1655 as a reference. Bacterial isolates and the respective genome sequence accession codes are presented in Supplemental Table S2.
Figure 6. Numbers of consistently or uniquely identified proteins in the E. cloacae study isolates 1 and 2 during the exponential and stationary growth phases. The diagrams were created using the Venn diagram web tool of the VIB and the University of Gent in Belgium (http://bioinformatics.psb.ugent.be/webtools/Venn/).
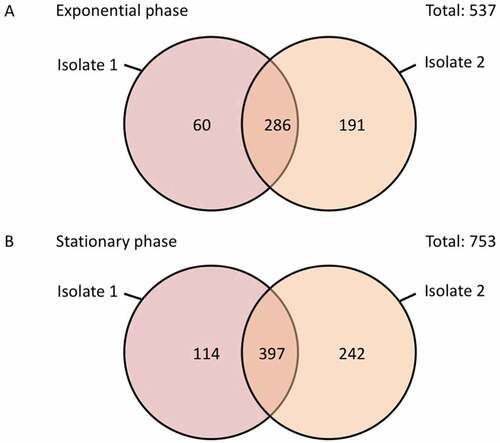
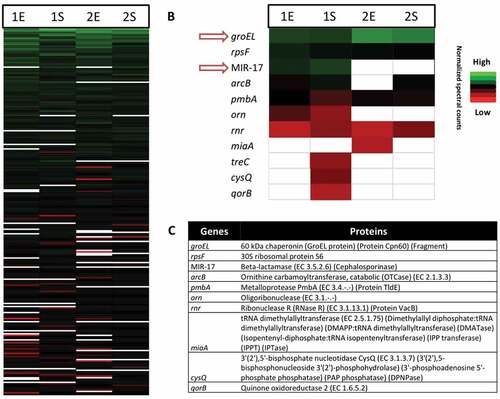
Figure 7. Proteomic profiles of the investigated E. cloacae study isolates 1 and 2 in the exponential and stationary growth phases. (a) Bar diagram depicting the relative amounts of 500/1300 identified E. cloacae proteins in the exponential (E) and stationary (S) growth phases based on normalized spectral counts. Relative amounts of identified proteins encoded by the MIR17-GI (b), and their respective functions (c).