Figures & data
Figure 1. Glial cell lines sustain viral loads and induce caspase in a manner similar to the accepted astrocyte model of VEEV infection. U-87 MG astrocytes and HMC3 microglia were inoculated with TC-83 (MOI:2 or MOI:10). (a) Production of infectious virus at 24h was confirmed via plaque assay. (b) qRT-PCR confirmed that TC-83 can successfully replicate in both cell lines. Activation of caspase-3/-7 in (c) U-87 MG astrocytes and (d) HMC3 microglial cells infected with TC-83 (MOI:2). 100nM Doxorubicin (DOX) was used as a positive control for caspase-3/-7 induction. The quantitative data are depicted as the means of six biologically independent experiments ± SD. ** p < 0.01; *** p < 0.001.
Figure 2. VEEV infection of microglial cells induces mitochondrial dysfunction. U-87 MG and HMC3 cells were inoculated with TC-83 (MOI:2 or MOI:10). Production of reactive oxygen species (ROS) was measured with 2ʹ,7ʹ-dichlorofluorescin (DCF) in infected (a) U-87 MG and (b) HMC3 cells. 100µM tert-butyl hydrogen peroxide (TBHP) was used as a positive control for ROS accumulation. Maintenance of the mitochondrial membrane potential (MMP) was measured with tetramethylrhodamine, ethyl ester (TMRE) in infected (c) U-87 MG and (d) HMC3 cells. 50µM carbonyl cyanide 4-(trifluoromethoxy) phenylhydrazone (FCCP) was a positive control for the disruption of MMP. The quantitative data are depicted as the means of six biologically independent experiments ± SD. * p < 0.05; ** p < 0.01; *** p < 0.001.
Figure 3. TC-83 induced inflammation in human astrocyte and microglial cells. (a-d) U-87 MG and (e-h) HMC3 cells were infected with TC-83 (MOI:2) and supernatants collected from these cells at 1, 2, and 6 hpi. Cytokine levels were determined for (a, e) IL-1α, (b, f) IL-1β, (c, g) IL-6, and (d, h) IL-8 in the context of direct TC-83 infection. The quantitative data are depicted as the means of three biologically independent experiments ± SD. * p < 0.05; ** p < 0.01.
Figure 4. Cytokines produced by TC-83 infected astrocytes induce massive microglia-mediated pro-inflammatory storm. (a) Experimental workflow indicating U-87 MG cells were infected with TC-83 (MOI:2) for 1h, with supernatants removed at 1hpi and 2hpi. These supernatants were overlaid on naïve HMC3 microglia and inflammatory cytokines measured at 1, 2, and 6h post overlay. Cytokine analysis reveals induction patterns of IL-1α, IL-1β, IL-6, and IL-8 in (b) 1h U-87 MG supernatants, and (c) 2h U-87 MG supernatants. (d) Plaque assay indicates the time frame in which U-87 MG and HMC3 cells release infectious viral particles. (e) A monoclonal antibody was queried for its ability to neutralize VEEV input virus (MOI:2) for 30 minutes. Virus titers post-incubation were determined via plaque assay. (f) U-87 MG cells were infected with TC-83 for 1h, followed by the addition of media containing 10µg neutralizing antibody. Supernatants were removed at 6h post overlay and analyzed via plaque assay for infectious viral titers. (g) Cytokine analysis of (direct) TC-83 infected and (indirect) microglia receiving 1hpi U-87 MG supernatants in the context of 10µg neutralizing antibody. All cytokines were measured at 2hpi. (d, f) ND indicates virus was not detectable at these time points. The quantitative data are depicted as the means of three biologically independent experiments ± SD. * p < 0.05; ** p < 0.01; *** p < 0.001.
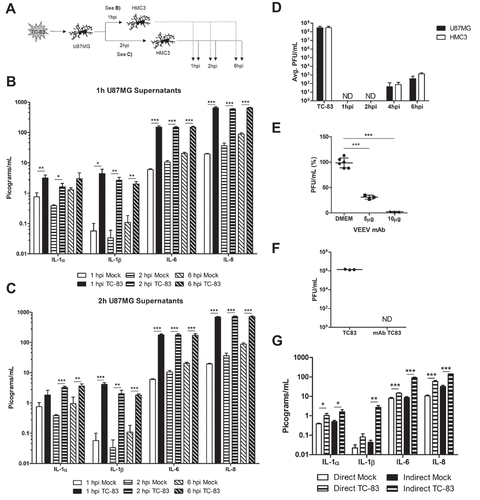
Figure 5. Pro-inflammatory response in direct infected and bystander primary cells. Primary human astrocytes (SVGp12) and primary human microglia (pHMC) were directly infected with TC-83 (MOI:2) and inflammatory cytokines analyzed at 2hpi. Separately, SVGp12 astrocytes were infected with TC-83 and supernatants transferred to naïve pHMC at 1hpi, with cytokine induction measured at 2h post overlay. Levels of the pro-inflammatory cytokines (a) IL-1α, (b) IL-1β, (c) IL-6, and (d) IL-8 are depicted as the means of six biologically independent experiments ± SD. * p < 0.05; ** p < 0.01; *** p < 0.001.
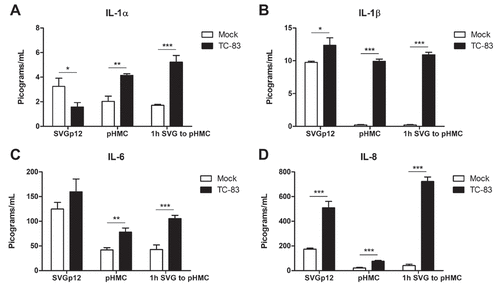
Figure 6. Anti-inflammatory intervention strategies are effective at mitigating mitochondrial damage during TC-83 infection. BAY 11–7082 (BAY-82) and mitoquinone mesylate (MitoQ) were analyzed for their ability to (a-b) decrease caspase-3/-7 induction, (c-d) rescue mitochondrial membrane potential, and (e-f) reduce production of reactive oxygen species in TC-83 inoculated (a, c, e) U-87 MG and (b, d, f) HMC3 cells. Controls: (a-b) Doxorubicin (DOX) was used as a positive inducer of the caspase-3/7 response. (c-d) Carbonyl cyanide 4-(trifluoromethoxy) phenylhydrazone (FCCP) is an ionophore uncoupler that induces MMP. (E-F) Tert-butyl hydrogen peroxide (TBHP) is a positive control for ROS accumulation. The quantitative data are depicted as the means of six biologically independent experiments ± SD. * p < 0.05; ** p < 0.01; *** p < 0.001.
Figure 7. Controlling TC-83 induced ROS response in microglial cells decreases inflammatory burden. (a) Experimental workflow indicating HMC3 cells were pre-treated for 2h with 0.1% DMSO, 1μM BAY 11–7082 (BAY-82), or 100pM mitoquinone mesylate (MitoQ) prior to inoculation with TC-83 (MOI:2). Levels of the pro-inflammatory cytokines (b) IL-1α, (c) IL-1β, (d), IL-6 and (e) IL-8 produced by HMC3 cells as the direct result of TC-83 infection were measured at 1, 2, and 6hpi. The quantitative data are depicted as the means of three biologically independent experiments ± SD. * p < 0.05; ** p < 0.01; *** p < 0.001.
Figure 8. Indirect inflammatory response dependent on mitochondrially derived ROS. (a) Experimental workflow indicating that U-87 MG cells were pre-treated for 2h with 0.1% DMSO, 1µM BAY 11–7082 (BAY-82), or 100pM mitoquinone mesylate (MitoQ) prior to inoculation with TC-83 (MOI:2). Supernatants were removed from infected U-87 MG cells at 2hpi and overlaid onto naïve HMC3 microglia, with (b) IL-1α, (c) IL-1β, (d) IL-6, and (e) IL-8 cytokine levels measured at 1, 2, and 6 hours post overlay. The quantitative data are depicted as the means of three biologically independent experiments ± SD. * p < 0.05; ** p < 0.01; *** p < 0.001.
Figure 9. IL-1β released by infected microglial cells prime astrocytes for increased TC-83 uptake. (a) Experimental workflow indicating the pre-treatment and infection schematic for HMC3 cells. Supernatants were removed from TC-83 inoculated HMC3 cells and overlaid onto naïve U-87 MG cells prior to inoculation of the astrocytes with TC-83 (MOI:2). (b) Production of infectious virus in these treatment conditions was measured at 6, 12, and 18hpi by plaque assay. (c-d) To determine which pro-inflammatory cytokines are contributing to the increase in TC-83 uptake, astrocytes were pre-treated with biologically relevant doses of IL-1α, IL-1β, IL-6, or IL-8 and production of infectious virus measured at 6, 12, and 18hpi by plaque assay. (e) Supernatants from HMC3 cells pre-treated with 100pg/mL IL-1β were overlaid on naïve U-87 MG astrocytes prior to TC-83 infection (MOI:2). Plaque assay measured production of infectious virus at 6, 12, and 18hpi. (f) The infection scheme from (a) was repeated in the context of 100µM Pirfenidone, a potent IL-1β inhibitor. (g) IL-1β gene expression was measured in the context of direct infected U-87 MG and HMC3 cells, and 1h supernatants from infected U-87 MG cells overlaid on naïve HMC3 microglia. Gene induction was determined via the ΔΔCτ method with 18S as the endogenous control. The quantitative data are depicted as the means of three independent experiments ± SD. For all images, representative data were selectively obtained from three individual experiments. * p < 0.05; ** p < 0.01; *** p < 0.001.
Figure 10. A hypothetical model of VEEV-induced neuroinflammatory environment. VEEV can directly infect astrocytes and microglia, leading to an accumulation of dysfunctional mitochondria. These mitochondrial events drive inflammatory cytokine signaling, which activate bystander microglia and further promote a pro-inflammatory environment. Continued induction of this inflammatory microenvironment leads to an increase in viral uptake, which may be dependent on IL-1β. Cumulatively, these events promote the spread of VEEV infection in the brain.