Figures & data
Figure 1. Construction of ΔRv0081 and ΔRv3334 of M. tb. (a) The coding sequence of Rv0081 or Rv3334 was replaced by a hygromycin resistance gene via homologous recombination using the left and right fragments (LF, RF). Primer pairs P1 and P2 were used to amplify the WT or the disrupted genes. The predicted size of PCR products containing Rv0081 and Rv3334 was 1.7- and 1.9- kb, respectively. The predicted size of PCR products for the knock out strains were 3.2 kb. (b) Agarose gel electrophoresis of the PCR products amplified from WT and knock out mutants. M: Marker, KO: knock out, WT: wild type.
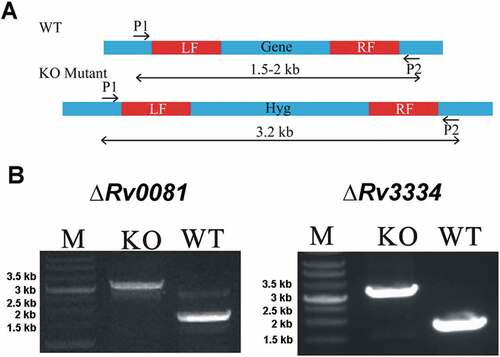
Figure 2. ΔRv0081 and ΔRv3334 exhibited defective growth under hypoxia. (a, c & d) Growth of ΔRv0081 under aerobic (a) and hypoxic conditions (c & d). (d) Cultures at the indicated time points from (c) were also plated to determine CFU. (b, e, & f) Growth of ΔRv3334 under aerobic (b) and hypoxic conditions (e & f). (f) Cultures at the indicated time points from (e) were also plated to determine CFU. (g) Growth of ΔRv0081 under aerobic conditions after recovery from 5-month hypoxia. (h) Growth of ΔRv3334 under aerobic conditions after recovery from 5-month hypoxia. Statistical analyzes (two-way ANOVA) were performed to compare all three groups. Significant differences between the mutant strain and WT or the complemented strain were indicated: *, p < 0.05; **, p < 0.01; ***, p < 0.001. In (c), the dashed line indicated that ΔRv0081 was significantly different (p < 0.001) to WT or the complemented strain at indicated time points (days 14, 20 and 29). COM: the complemented strains.
Figure 3. The gene expression profiles of ΔRv0081 and ΔRv3334 are highly similar. (a) Overlap of DEGs in hypoxic cultures of ΔRv0081 and ΔRv3334, each compared to WT cultures under hypoxia. (b) The expression levels of 532 overlapped DEGs in ΔRv0081 and ΔRv3334 were compared and plotted. The correlation coefficient (R [Citation2]) was calculated. (c) Overlap of the downregulated genes in hypoxic cultures of ΔRv0081 and ΔRv3334, compared to WT hypoxic culture. (d) Overlap of the upregulated genes in hypoxic cultures of ΔRv0081 and ΔRv3334, compared to WT hypoxic culture. The hypergeometric p values were calculated for each overlap analysis. (e & f) RT-PCR validation of RNA-seq data. Twelve genes including Rv0081, Rv3334 and sigA were selected for RT-PCR analysis. The expression levels of each gene relative to sigA in hypoxic cultures were determined by RT-PCR and compared between WT and the mutant strains.
![Figure 3. The gene expression profiles of ΔRv0081 and ΔRv3334 are highly similar. (a) Overlap of DEGs in hypoxic cultures of ΔRv0081 and ΔRv3334, each compared to WT cultures under hypoxia. (b) The expression levels of 532 overlapped DEGs in ΔRv0081 and ΔRv3334 were compared and plotted. The correlation coefficient (R [Citation2]) was calculated. (c) Overlap of the downregulated genes in hypoxic cultures of ΔRv0081 and ΔRv3334, compared to WT hypoxic culture. (d) Overlap of the upregulated genes in hypoxic cultures of ΔRv0081 and ΔRv3334, compared to WT hypoxic culture. The hypergeometric p values were calculated for each overlap analysis. (e & f) RT-PCR validation of RNA-seq data. Twelve genes including Rv0081, Rv3334 and sigA were selected for RT-PCR analysis. The expression levels of each gene relative to sigA in hypoxic cultures were determined by RT-PCR and compared between WT and the mutant strains.](/cms/asset/6d9c226d-7424-40e5-b2d4-9230ffc98f5b/kvir_a_1514237_f0003_oc.jpg)
Figure 4. Rv0081 binds the promoter of Rv3334. (a) Schematic representation of different fragments upstream of Rv3334 that were used in EMSAs to identify the binding site of Rv0081. DNA fragments are labeled as Fragment 1 to 4 and Fragment UP. Their corresponding positions with respect to start codon are indicated. The region marked by yellow shadow represents the 22-bp palindromic sequence, which is the binding site of Rv3334. (b) EMSA with Fragment UP. Lane 1: no protein; lane 2: 288 ng Rv0081 protein; lane 3: 576 ng Rv0081 protein. (c) EMSA with Fragment 1 to 4. For all reactions, 576 ng purified Rv0081 was used. Presence and absence of protein are indicated by (+) and (−), respectively. Lanes 1 & 2: positive control; lanes 3 & 4: negative control; lanes 5 & 6: Fragment 1; lanes 7 & 8: Fragment 2; lanes 9 & 10: Fragment 3; lanes 11 & 12: Fragment 4. (d & e) FAM-labeled Fragment 1 (d) and Fragment 3 (e) (10 pmol each) were applied in chasing system and visualized by fluorescence radiation. Lane 1: no Rv0081 protein; lanes 2 to 5: Rv0081 protein at 288-, 576-, 864- and 1152-ng were added; lanes 6 to 10: Rv0081 (1152 ng) and excessive unlabeled specific DNA were added; lanes 11 to 15, Rv0081 (1152 ng) and excessive unlabeled nonspecific DNA were added. PC: positive control, a 59-bp DNA fragment from the upstream region of Rv0081. NC: negative control, a 40-bp fragment from the upstream of hycD.
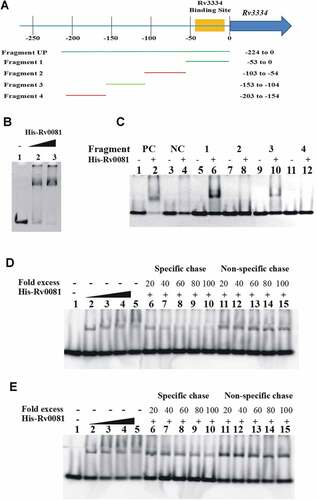
Figure 5. The first 10 bp and the 22 bp palindrome upstream of Rv3334 are both required for the binding of Rv0081. (a) The 22-bp palindromic sequence in the upstream region of Rv3334 was highlighted in red. The binding site of Rv0081 was indicated (−40 to −1). (b) EMSA of Fragment 5 (−40 to −10) and 6 (−73 to −40). Lanes 1 to 3: positive control DNA probe added with 0-, 288- and 576- ng Rv0081 protein, respectively; lanes 4 to 6: negative control DNA probe added with 0-, 288-, and 576- ng Rv0081, respectively; lanes 7 to 9: Fragment 1 added with 0-, 288-, and 576- ng Rv0081, respectively; lanes 10 to 12: Fragment 5 added with 0-, 288-, and 576- ng Rv0081, respectively; lanes 13 to 15: Fragment 6 added with 0-, 288-, and 576- ng Rv0081, respectively. (c) EMSA of smaller fragments: Fragment a (−54 to −25), b (−54 to −17), and c (−54 to −9). Lanes 1 & 2: positive control DNA added with 0- and 576- ng Rv0081 protein, respectively; lanes 3 & 4: negative DNA added with 0- and 576- ng Rv0081 protein, respectively; lanes 5 & 6: Fragment 1 added with 0- and 576- ng Rv0081 protein, respectively; lanes 7 & 8: Fragment an added with 0- and 576- ng Rv0081 protein, respectively; lanes 9 & 10: Fragment b added with 0- and 576- ng Rv0081 protein, respectively; lanes 11 & 12: Fragment c added with 0- and 576- ng Rv0081 protein, respectively. PC: positive control, a 59-bp DNA fragment from the upstream region of Rv0081. NC: negative control, a 40-bp fragment from the upstream of hycD.
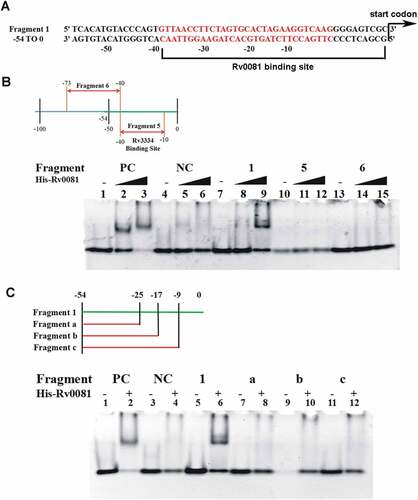
Figure 6. Rv0081 forms dimer. Purified Rv0081 protein was cross-linked by treatment with glutaraldehyde and then analyzed by SDS-PAGE and Coomassie blue staining (a) or Western blot (b). (a) lane 1: molecular weight marker; lane 2: Rv0081 without glutaraldehyde treatment; lanes 3 &4: Rv0081 treated with glutaraldehyde for 30 sec and 1 min, respectively. (b) Lanes 1: Rv0081 without glutaraldehyde treatment; lanes 2 & 3: Rv0081 treated with glutaraldehyde for 30 s and 1 min, respectively.
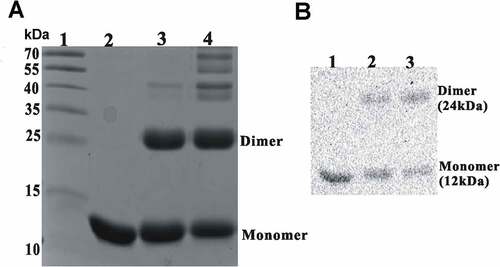
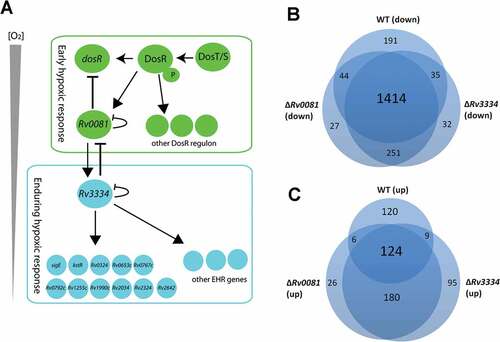
Figure 7. (a) Proposed model for the regulatory network of M. tb in response to hypoxia. See text for details. (b &c) Hypoxia induced changes of gene expression profiles in WT, ΔRv0081 and ΔRv3334. Overlap of downregulated genes in hypoxic cultures of WT, ΔRv0081 and ΔRv3334 relative to their respective aerobic cultures (b). Overlap of upregulated genes in hypoxic cultures of WT, ΔRv0081 and ΔRv3334 relative to their respective aerobic cultures (c).