Figures & data
Figure 1. Comparison between DIC imaging with Percoll and India ink staining. C. neoformans cells were incubated in two different capsule-inducing conditions (MM and Sab-MOPS) and in non-inducing Sabouraud medium for 24 h prior to imaging with the method we describe and the standard India ink staining. (a) Shows representative images, whereas (b) shows that capsule thickness measurements yield similar results with both methods. The scale bar in (a) equals 5 µm. The lines in (b) represent the mean capsule thickness of 20 individual cells. The p-values shown in (b) were calculated by the Kolmogorov-Smirnov test comparing measurements with India ink and Percoll.
Figure 2. Time-lapse imaging of C. neoformans capsule growth in inducing medium (Sab-MOPS). C. neoformans cells were incubated in Sab-MOPS supplemented with 50% Percoll and imaged every 10 minutes by DIC microscopy. The images that were used to make this figure were compiled in Supplemental video 1. (a) Shows some of the images, with a 60-minute interval between each image. The arrows point to the same cell at different time points; this cell was used to make Figures 2(b) and (b). (b) Shows the capsule thickness measured every 30 minutes and the line represents an asymmetric sigmoidal curve that was fit to the data (r2 = 0.98). In (c), capsule volume was calculated at several time points for seven different cells using cell body and capsule diameter measurements from micrographs as described in the text. Curves were fitted to the values using the Gompertz growth curve model in Graphpad Prism 6 (adjusted r2 values shown). The curves generated for each dataset were compared to test for variation in the slope (k) and the preferred model, with a probability greater than 99.99%, was found to be that k is different for each curve. Gaps in some curves correspond to periods in the time series when the cells drifted out of focus, making it impossible to perform measurements.
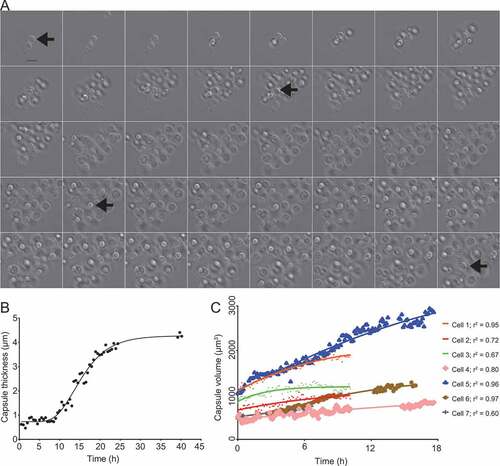
Figure 3. Comparison between the capsule thicknesses of one mother cell and it multiple buds. (a) Shows the same mother cell indicated by arrows on ), which appears Supplemental video 1, but at the specific time points in which each of six successive buds (arrows) can first be seen to be completely separated from the mother cell. The actual images, capsule measurements and how much time had elapsed after the cells were transferred to capsule inducing media are indicated in the figure. In (b), the bud capsule sizes are plotted into a zoomed-in version of the curve shown in ), which shows capsule growth kinetics for the mother cell.
Figure 4. Capsule thicknesses of four mother cells and their buds. (a–d) show the capsule thickness of four mother cells and their buds. The arrows point to the first time point in which the bud can be seen emerging in the cell wall of its mother cell, whereas the star indicates the bud’s capsule thickness at the first time point in which its cell wall has clearly separated from that of its mother cell.