Figures & data
Figure 1. Survival analysis of immunosuppressed mice intranasally infected with Aspergillus fumigatus. Mice were immunosuppressed with two intraperitoneal doses of cyclophosphamide, 150 mg/Kg and 100 mg/Kg, four days and one day before infection, respectively. Animals were infected with 1 x 10⁶, 1 × 10⁷ and 1 × 10⁸ A. fumigatus resting conidia/animal. Non-infected animals were used as controls.
Figure 2. Histology of infected lungs. To study the fungal progression and the subsequent tissue damage, lung slices were stained with Grocott’s methenamine silver (G.M.S.) and haematoxylin-eosin (H.E.). White arrows show: (A) conidia in the lumen airways, (B and C) hyphae in lung parenchyma, (D) hyphae in lung parenchyma and inside venous vessels. Black arrows show vascular walls: (C) arterial and (D) venous vessels.
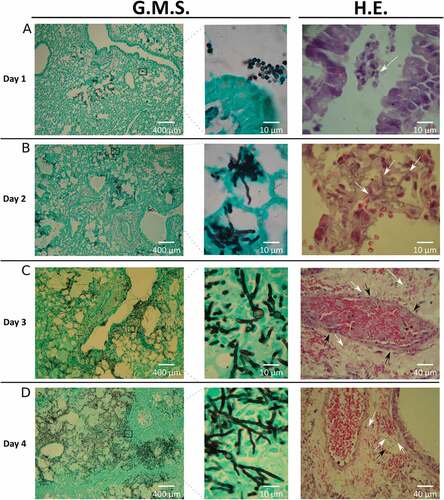
Figure 3. Gene ontology enrichment of differential expressed genes (DEGs). Percentage of down-regulated and up-regulated genes belonging to one of GO categories: (A and D) cellular components, (B and E) molecular functions and (C and F) biological process. The graphics only included the most representative groups (> 4%). Raw data are included in the table S4.
Table 1. Results of Differential Expressed Genes (DEGs) detected using microarray technologies versus expression data using specific primers in RT-qPCR.
Figure 4. Schematic representation of the intertwined fumagillin/pseurotin gene cluster. Red arrows indicate the up-regulated DEGs relative to the first day post-infection. Graphics represent the log2 fold change (FC) obtained by AWAFUGE microarray and RT-qPCR assays. FumR/FapR is the transcription factor that regulates fumagillin and pseurotin production. PKS/NRPS regulates pseurotin production. ND: Not determined by RT-qPCR.
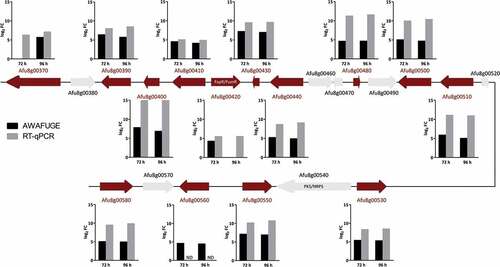
Figure 5. Cell damage and fumagillin production during co-incubation of A. fumigatus with A549 cells. (A and B) Extent of A. fumigatus-induced damage to the A549 pulmonary epithelial cell line. The indicated strains of A. fumigatus were incubated with A549 cells for 20h, and the extent of epithelial cell damage was determined using a 51Cr release assay. Results in (A) are a box-whisker plot of three independent experiments, each performed in duplicate. Results in (B) are from three independent experiments, each performed in triplicate. **p < 0.01; **** p < 0.0001. (C) HPLC chromatograms of indicated sample fractions from A549 cells co-incubated with A. fumigatus conidia after 24 h and respective controls (cells without A. fumigatus conidia, conidia without cells and media only). Samples were prepared as described in Material and Methods. The wavelength of the shown chromatograms was set to 340 nm, which is the absorption maximum for fumagillin detected at 14.5 min. Fumagillin was absent in the ∆fmaA mutant.
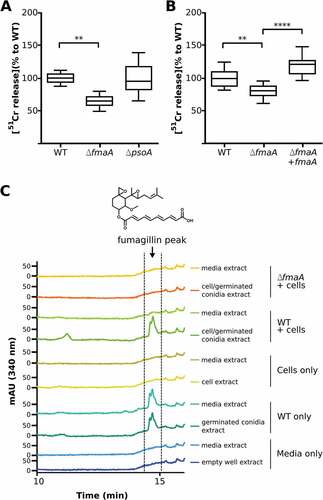
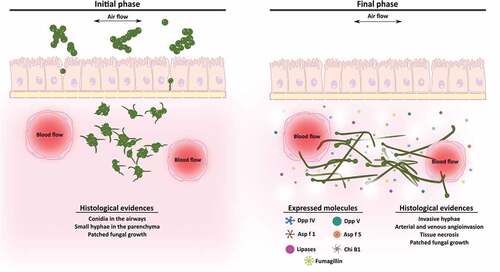
Figure 6. Scheme of the development of an Aspergillus fumigatus intranasal infection in a murine model. In the initial stages of the infection (1st and 2nd days), fungal conidia colonize the lung tissue and start to germinate invading the parenchyma. By contrast, during the final phase of the infection (3rd and 4th days), which are associated with angioinvasion and tissue necrosis, the fungus continues growing and forming invasive hyphae and increasing the expression of genes related to virulence such as lytic enzymes and fumagillin.