Figures & data
Figure 1. Effects of ccs4 deletion on pneumococcal growth and expression of ccs4. (a) Growth curves of WT, Δccs4, and Δccs4 [pCcs4] strains. Values are presented as the mean of 5 samples from a representative experiment. (b) Expression of ccs4 gene. The level of ccs4 expression in the Δccs4 and Δccs4[pCcs4] strains was examined by qPCR and shown relative to that of the WT strain. 16S rRNA was used as the internal control. Values are presented as the mean of 3 samples from the representative of 3 independent experiments. Vertical lines represent the mean + S.E.
![Figure 1. Effects of ccs4 deletion on pneumococcal growth and expression of ccs4. (a) Growth curves of WT, Δccs4, and Δccs4 [pCcs4] strains. Values are presented as the mean of 5 samples from a representative experiment. (b) Expression of ccs4 gene. The level of ccs4 expression in the Δccs4 and Δccs4[pCcs4] strains was examined by qPCR and shown relative to that of the WT strain. 16S rRNA was used as the internal control. Values are presented as the mean of 3 samples from the representative of 3 independent experiments. Vertical lines represent the mean + S.E.](/cms/asset/c4af0c4b-79f5-4350-87bf-b005ecef330a/kvir_a_1526530_f0001_b.gif)
Figure 2. Pneumococcal interaction with hBMECs and A549 cells. (a) Rates of association with and invasion into hBMECs by S. pneumoniae TIGR4 WT, Δccs4, and Δccs4[pCcs4] strains. (b) Rates of association with and invasion into A549 cells by S. pneumoniae WT, Δccs4, and Δccs4[pCcs4] strains. Association rates were calculated by dividing the CFU value obtained at 1 hour after infection by the value for the original inoculum. Invasion rates were calculated by dividing the CFU value obtained at 1 hour after antibiotic addition by the value for the original inoculum. Values are presented as the mean of 6 wells from one of 3 independent experiments. Vertical lines represent the mean + S.E. Statistical differences between groups were analyzed using a Kruskal-Wallis test with Dunn’s post hoc test. (c) Expression levels of nanA and cbpA. The nanA and cbpA gene expression levels in the Δccs4 strain were examined by qPCR, and shown relative to that of the WT strain. 16S rRNA was used as the internal control. Data are presented as the mean of 3 representative samples from the representative of 3 independent experiments. Vertical lines represent the mean + S.E. *p < 0.05 and **p < 0.01.
![Figure 2. Pneumococcal interaction with hBMECs and A549 cells. (a) Rates of association with and invasion into hBMECs by S. pneumoniae TIGR4 WT, Δccs4, and Δccs4[pCcs4] strains. (b) Rates of association with and invasion into A549 cells by S. pneumoniae WT, Δccs4, and Δccs4[pCcs4] strains. Association rates were calculated by dividing the CFU value obtained at 1 hour after infection by the value for the original inoculum. Invasion rates were calculated by dividing the CFU value obtained at 1 hour after antibiotic addition by the value for the original inoculum. Values are presented as the mean of 6 wells from one of 3 independent experiments. Vertical lines represent the mean + S.E. Statistical differences between groups were analyzed using a Kruskal-Wallis test with Dunn’s post hoc test. (c) Expression levels of nanA and cbpA. The nanA and cbpA gene expression levels in the Δccs4 strain were examined by qPCR, and shown relative to that of the WT strain. 16S rRNA was used as the internal control. Data are presented as the mean of 3 representative samples from the representative of 3 independent experiments. Vertical lines represent the mean + S.E. *p < 0.05 and **p < 0.01.](/cms/asset/2d733f3f-08bc-4c41-bacc-f68c7431addf/kvir_a_1526530_f0002_b.gif)
Table 1. PCR primers used in this study.
Table 2. MIC and MBC of LL-37 against each strain.
Figure 3. Effects of heparin pretreatment on association with and invasion into hBMECs by S. pneumoniae. Association rates were calculated by dividing the CFU value obtained at 1 hour after infection by the value for the original inoculum. Invasion rates were calculated by dividing the CFU value obtained at 1 hour after antibiotic addition by the value for the original inoculum. Values are presented as the mean of 6 wells from one of 3 independent experiments. Vertical lines represent the mean + S.E. Statistical differences between groups were analyzed using Mann-Whitney’s U-test. *p < 0.05 and **p < 0.01.
Figure 4. Bacterial survival in mouse blood and biofilm formation ability. (a) The ccs4 gene deletion had no effects on pneumococcal survival in mouse blood. Bacteria were incubated in heparinized mouse blood at 37°C for 1, 2, or 3 hours in a 5% CO2 atmosphere. Survival rate was calculated by dividing the CFU value after the period of incubation by the CFU value of the original inoculum. Values are presented as the mean of 6 wells from one of 3 independent experiments. Vertical lines represent the mean + S.E. (b) Effect of ccs4 deletion on pneumococcal biofilm formation was assessed following incubation in THY at 37°C for 16 hours. Biofilm formed in 96-well microtiter plates was stained with Gram’s stain solution and absorbance was measured at 550 nm. The experiments were performed 3 times and data shown represent the mean of 6 wells from one of 3 independent experiments. Data are displayed as a box-whisker plot (min-[lower quartile–median-upper quartile]-max). Statistical differences between groups were analyzed using Mann-Whitney’s U-test. (c) Representative microscopic images of bacterial aggregation from WT strain-derived biofilm (left), and Δccs4 strain mutant-derived biofilm (right). Scale bars indicate 100 μm.
![Figure 4. Bacterial survival in mouse blood and biofilm formation ability. (a) The ccs4 gene deletion had no effects on pneumococcal survival in mouse blood. Bacteria were incubated in heparinized mouse blood at 37°C for 1, 2, or 3 hours in a 5% CO2 atmosphere. Survival rate was calculated by dividing the CFU value after the period of incubation by the CFU value of the original inoculum. Values are presented as the mean of 6 wells from one of 3 independent experiments. Vertical lines represent the mean + S.E. (b) Effect of ccs4 deletion on pneumococcal biofilm formation was assessed following incubation in THY at 37°C for 16 hours. Biofilm formed in 96-well microtiter plates was stained with Gram’s stain solution and absorbance was measured at 550 nm. The experiments were performed 3 times and data shown represent the mean of 6 wells from one of 3 independent experiments. Data are displayed as a box-whisker plot (min-[lower quartile–median-upper quartile]-max). Statistical differences between groups were analyzed using Mann-Whitney’s U-test. (c) Representative microscopic images of bacterial aggregation from WT strain-derived biofilm (left), and Δccs4 strain mutant-derived biofilm (right). Scale bars indicate 100 μm.](/cms/asset/0c833144-6b83-4520-9416-1dd9f0ebce5a/kvir_a_1526530_f0004_c.jpg)
Figure 5. The ccs4 gene deletion decreases pneumococcal pathogenesis in vivo and invasion into brain. CD-1 mice were infected with the S. pneumoniae TIGR4 WT, Δccs4, or complement strain. (a) Intravenous injections were performed with ~ 6.0 × 10⁶ CFU in 100 μL of PBS and intranasal injections with ~ 7.5 × 10⁷ CFU in 20 μL of PBS. Mouse survival was monitored for 10 days. Statistical differences between groups were analyzed using a log-rank test. **p < 0.01 versus Δccs4 strain-infected mice. (b) In the intravenous infection model, bacterial burden in the blood and brain were assessed after 24 hours of infection. S.E. values are represented by vertical lines. Statistical differences between groups were analyzed using a Kruskal-Wallis test with Dunn’s post hoc test. *p < 0.05 and **p < 0.01. (c) Bacterial burden in bronchoalveolar lavage fluid (BALF) was assessed at 24 hours after infection in pneumonia model mice. Values are presented as the mean of 8 samples from 2 independent representative experiments. Vertical lines represent the mean ± S.E. Statistical differences between groups were analyzed using Mann-Whitney’s U-test. (d) Representative microscopic images of brain vascular tissues from WT (left), ccs4 mutant (center), and complement (right) strain-infected mice showing staining for S. pneumoniae TIGR4 (green), brain vascular endothelial cells (red), and nuclei (blue). Triangles indicate S. pneumoniae binding or invasion of brain vascular endothelial cells. Arrows indicate S. pneumoniae invading the brain tissue. Vessel lumens are marked with VL. Scale bars indicate 10 μm. *p < 0.05 and **p < 0.01 versus control.
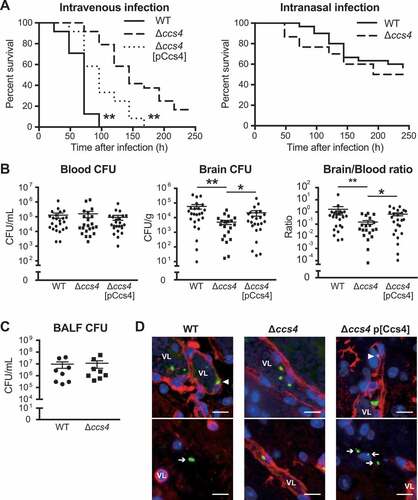
Figure 6. Levels of proinflammatory cytokines in mouse plasma. Plasma samples were collected from intravenous infection model mice at 24 hours after infection. Values are presented as the mean of 12 samples. Vertical lines represent the mean ± S.E. Statistical differences between groups were analyzed using Mann-Whitney’s U-test.