Figures & data
Figure 1. Macrophages express FN during inflammatory responses. Mouse lung tissues after LPS treatment were stained with nuclear SiR-DNA-Red, anti-FN Ab-Alex 488 and Anti-CD11b-APC and observed with confocal microscopy (a) and quantification of FN expression in confocal images of LPS treated lung compared with vehicle-treated lung (b) (n = 11,*p < 0.05). Expression of FN in macrophages around human lung cancer (c) and quantification of FN expression in confocal images of LPS treated lung compared with vehicle-treated lung (d) (n = 11,*p < 0.05). Human lung cancer tissues were stained with SiR-DNA-Red, anti-FN Ab-Alex 488 and Anti-CD163-Violet 421 and observed with confocal microscopy (x 40); FN mRNA level of peritoneal macrophages was measured after PAMPs stimulation by q-PCR. (n = 5, *p < 0.05). Briefly, 1 × 10⁶ peritoneal macrophages/well (24 well culture plate) were cultured with LPS (1ug/ml), PGN (10 ug/ml), LTA (5 ug/ml), Mannan (5 ug/ml) and Zym (10 ug/ml) for 4 hours at 37oC. The cell samples were collected with Easy RNA kit and cDNAs were prepared by high-efficiency cDNA kit. FN was quantified by TaqMan real-time PCR system with Taqman FN probe (e); FN expression of peritoneal macrophages was analyzed by western blot After LPS, PGN, and LTA (f), and quantification of the western blot was completed with ImageJ software (g). (n = 3, *p < 0.05). Statistical comparisons among treatment groups were performed by randomized-design two-way ANOVA, followed by the Newman-Keuls post hoc test for more than two groups, or by unpaired Student’s t-test for two groups using Prism software (Graph Pad Inc., La Jolla, CA), as appropriate. Statistical significance was defined as a P value of less than 0.05.
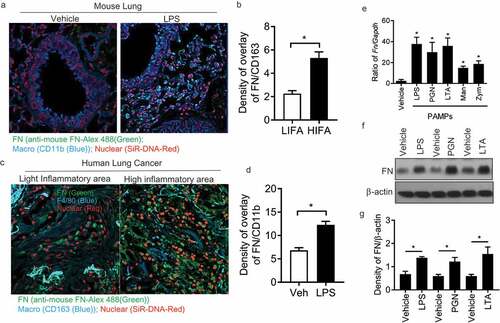
Figure 2. FN enhanced IL-6 and TNFα responses of macrophages to PAMPs. Peritoneal macrophages (2x10⁶ cells/well) from C57L/B6 mice were cultured in 24 well culture plate, and the cells were stimulated with LPS, PGN, LTA, Man and Zym for four h. The supernatants were collected and assayed for TNFα (a) and IL-6 (b) production with ELISA kit. Data are means of triplicates. (n = 3, *p < 0.05). Statistical comparisons among treatment groups were performed by randomized-design two-way ANOVA, followed by unpaired Student’s t-test for two groups using Prism software (Graph Pad Inc., La Jolla, CA). Statistical significance was defined as a P value of less than 0.05.
Figure 3. FN functions as an opsonin for macrophage phagocytosis. The effect of FN in macrophage phagocytosis to FITC conjugated E. coli was analyzed by FACS (a). Briefly, peritoneal macrophages from WT mice and bacteria were mixed in suspension at a ratio of 1:10 (cell: bacteria) with and without FN. FITC-E. coli positive cell of macrophages was analyzed by FACS (a); FcγR-mediated phagocytosis of macrophages was also analyzed by FITC-IgG latex beads with/without FN (b). Peritoneal macrophages were cultured on glass coverslips and incubated with IgG-coupled latex at a ratio of 1:10 for 15–30 min at 37°C to assay phagocytosis. Phagocytosis was assessed by detecting the percent of the FITC+ cells by FACS. n = 6. ∗, p < 0.01. FN promotes expression of total Rac1 and Cdc42 proteins in peritoneal macrophages after stimulation with LPS and PGN, as determined by Western blot analysis (c). The cells lysates were fractionated by 12% SDS-PAGE gel. Expression of actin serves as a loading control and density of Rac1/β-actin and (d) Cdc42/β-actin (e) was quantified with Image J software. (n = 3, *p < 0.05). Statistical comparisons among treatment groups were performed by randomized-design two-way ANOVA, followed by unpaired Student’s t-test for two groups using Prism software (Graph Pad Inc., La Jolla, CA). Statistical significance was defined as a P value of less than 0.05.
Figure 4. Ablation of Integrin β1 has defective responses to LPS and PGN in macrophages. Il6 (a) and Tnfα (b) mRNA expression were quantified by qPCR after LPS and PGN stimulation in WT and integrin β1-/- macrophages (n = 5, *p < 0.05). IL-6 (c) and TNFα (d) protein level were detected in the supernatant of WT and integrin β1-/- macrophages after LPS and PGN stimulation by ELISA (n = 5, *p < 0.05). Phagocytosis of integrin β1+/+ and integrin β1-/- macrophages to FITC conjugated E. coli was examined by FACS (e). Peritoneal macrophages from integrin β1-deficient and WT mice and FITC-labeled bacteria opsonized with normal mouse serum were mixed in suspension for 30 min at 37°C at a ratio of 1:100 (cell/bacteria). Phagocytosis was assessed by detecting the MFI of the cells after quenching by FACS. (n = 6, *p < 0.05). Total Rac1, Rac2 and Cdc42 protein in integrin β1-/- and integrin β1+/+ peritoneal macrophages were analyzed by western blot after LPS and PGN stimulation (f), and Rac1 (g), Rac2 (h) and Cdc42 (i) densities were quantified by comparing with β-actin with ImageJ software. (n = 3, *p < 0.05). The activity of Rac1, Rac2 and Cdc42 protein in integrin β1-/- and integrin β1+/+ peritoneal macrophages were also analyzed by western blot after LPS stimulation (j). Il6 (k) and Tnfα (l) mRNA expression of macrophages were quantified by qPCR with and without integrin β1 blocking peptide after LPS and PGN stimulation (n = 5, *p < 0.05). Phagocytosis of macrophages to FITC conjugated E. coli was examined with/without integrin β1 blocking peptide by FACS (m). (n = 5, *P < 0.05). Statistical comparisons among treatment groups were performed by randomized-design two-way ANOVA and followed by unpaired Student’s t-test for two groups using Prism software (Graph Pad Inc., La Jolla, CA). Statistical significance was defined as a P value of less than 0.05.
Figure 5. FN has an impaired phagosome/lysosome fusion of macrophages in integrin β1-/- macrophages. Confocal images showing the colocalization of AF488-labeled E. coli with Lysotracker Red in integrin β1-/- macrophages (β1-/-) and integrin β1+/+ macrophages(β1+/+). To observe the effect of FN plus LPS in regulating phagosome/lysosome fusion of integrin β1+/+ (a) and integrin β1-/- (b) macrophages, Integrin β1+/+ and integrin β1-/- peritoneal macrophages pre-adhered to coverslips were preloaded with Lysotracker Red and incubated with opsonized AF488-E. coli at a ratio of 1:50 (cell/bacteria), and taken the images at 0, 25, 30, 35, 40, 45, 50, 55, 60, 65,70, 75, 80, 85 and 90 min at 37°C with LPS (1ug/ml) plus FN (1 ug/ml) by laser confocal microscopy. Since macrophage phagosomes are often formed at about 30 min after macrophage phagocytosis to bacteria, for the observation of FN plus PGN (c), the colocalization images of phagosome with lysosome were taken only at 30 min with PGN (1ug/ml) alone and PGN(1ug/ml) plus FN(1ug/ml) in integrin β1-/- macrophages and integrin β1+/+ macrophages (lower panel in C), and the colocalization white field images of phagosome with lysosome were also taken in the same time (upper panel in C). In addition, to determine the kinetics of phagosome maturation, the co-localization of AF488-labeled E. coli with Lysotracker Red was examined by laser confocal microscopy (LSM 710, Carl Zeiss) at every minute interval from starting the macrophages of integrin β1-/- or integrin β1+/+ mice mixed with FITC-conjugated E. coli and adding FN plus LPS (d) or FN plus PGN (e) up to 50 min. The percentage of E. coli -containing phagosomes that co-localized with Lysotracker (fluorescence overlay) was quantitatively analyzed using the co-localization dialogue of Metamorph software version 7.0 (Universal Imaging, a subsidiary of Molecular Devices) by randomly scanning > 10 cells in each test group in 3 independent experiments (d and e). (n = 3, *p < 0.05). Statistical comparisons among treatment groups were performed by randomized-design two-way ANOVA and followed by unpaired Student’s t-test for two groups using Prism software (Graph Pad Inc., La Jolla, CA). Statistical significance was defined as a P value of less than 0.05.
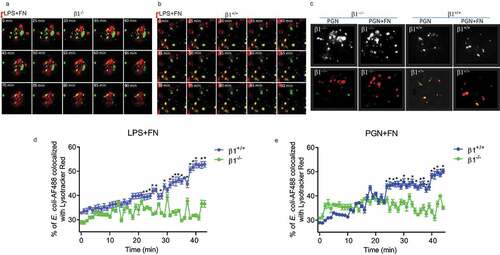
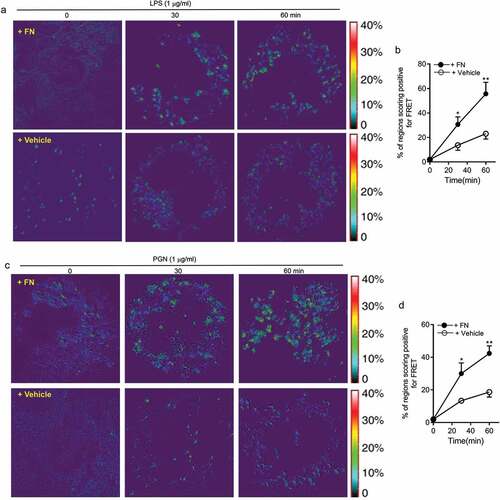
Figure 6. FN significantly promotes innate immune responses of macrophages through interaction of FN-integrin β1 signal and TLR2/TLR4 signal. FRET assay measuring the access of an integrin β1-associated donor fluor AF488 or FITC-TLR4 or TLR2-localized with fluor AF594 or PE-integrin β1 was used to quantify the association of TLR4 or TLR2 and integrin β1 following LPS (a and b) or PGN (c and d) with or without FN. After stimulation of LPS or PGN for 0 min and a chase of 30, 60 min at 37°C, FRET was measured by laser confocal microscopy using the FRET Acceptor Bleaching program, which verifies the donor molecule’s loss of intensity when in close proximity to an acceptor molecule, before and after selective bleaching of the acceptor. Representative images from FRET assay showing the association of AF488-labeled TLR4 Ab or TLR2Ab with AF594-labeled integrin β1 Ab in peritoneal macrophages (a and c). Comparison of the percentage of FRET-positive regions and FRET efficiency between integrin β1 and TLR4 or TLR2 with fibronectin or without in peritoneal macrophages (b and d). The energy transfer efficiency was quantified, as described in Materials and Methods. The percentages of FRET-positive regions were quantified by randomly counting over 10–15 areas within one cell and counting > 10 cells in each tested group in three or more independent experiments. Data are mean ± SE from triplicate samples and are representative of three independent experiments. ∗ p < 0.01; ∗∗, p < 0.05. Statistical comparisons among treatment groups were performed by randomized-design two-way ANOVA and followed by unpaired Student’s t-test for two groups using Prism software (Graph Pad Inc., La Jolla, CA). Statistical significance was defined as a * P value of less than 0.05 and . as a ** P value of less than 0.01.