Figures & data
Figure 1. Complement activation and DC interactions depend on cell wall composition. (a) Melanin- and β-1,3-glucan-lacking strains demonstrate significantly higher surface C3-deposition. Significantly higher covalently linked C3 levels were detected on ∆pksP (left) and fkstetOnrep (right) compared to their respective WT (46645, AfS35). Non-opsonized counterparts served as controls for background C3c-binding. A summary from 6 different experiments (n = 6) is shown for pksP opsonization, and from 10 experiments (n = 10) for fks opsonization. Binding (b) and internalization (c) of non- and C-opsonized swollen conidia by DCs. For binding (4°C) and internalization (37°C) analyzes, percentages of FITC-labelled conidia bound and/or internalized to live CD11chigh DCs from at least 5 independent experiments were assessed by multi-color flow cytometry. The gating strategy is depicted on the left. Differences were analyzed by one-way ANOVA using Bonferroni´s post test for multiple comparisons.
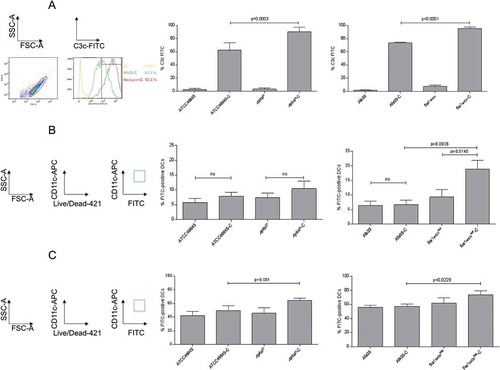
Figure 2. C-opsonized conidia show an improved up-take into DCs. After 6h of co-culture at 37°C, CD11b (yellow) in DCs co-localized with opsonized fungal conidia (green) (a and b, panels ∆pksP-C and fkstetOnrep-C), whereas DC-SIGN (red) was found to be highly involved in binding of germlings (a, arrow) and non-opsonized conidia (b, upper panel). Higher amounts of opsonized fungal conidia were bound/internalized by DCs compared to non-opsonized conidia. A more detailed analysis of the specific involvement of DC-SIGN (red) in internalizing non-opsonized and CD11b (yellow) in taking-up opsonized conidia is depicted in Figure 2(b). Left panels depict all fluorescence channels (green: conidia, red: DC-SIGN, yellow: CD11b, blue: nucleus), while in right panels the FITC channel was switched off to emphasize the involvement of DC-SIGN in internalization of non-opsonized and CD11b in up-take of opsonized fungal conidia. Data shown are representative of 3 independent experiments. Scale bar represents 10µm.
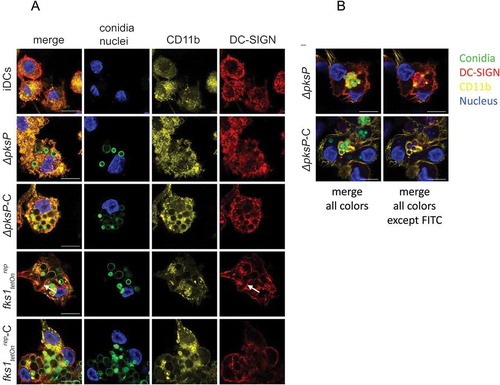
Figure 3. Binding and Internalization of complement-opsonized conidia are impaired upon knock-out of either CD11b or CD11c. CD11b KO- (gray) and CD11c KO THP1-DCs (dark gray) or their respective WT THP1-DCs (black) were incubated for 6h at 4°C (a) or 37°C (b) with non-opsonized (left) or opsonized (right) fungal strains and binding (a) or internalization (b) were analyzed by flow cytometry. While all non-opsonized fungal preparations showed similar binding (a) and internalization (b) to THP1 KO and WT DCs (left), knock-out of CD11b (gray) and CD11c (dark gray) resulted in an impaired binding (a) and internalization (b) process of opsonized fungi (right). Highest impairment in binding (a) and internalization (b) were analyzed for the opsonized mutants ∆pksP-C and fkstetOnrep-C using both, CD11b KO (right, gray) and CD11c KO THP1-DCs (right, dark gray) compared to WT THP1-DCs (right, black). For both analyzes, percentages of FITC-labeled conidia bound and/or internalized by live CD11chigh DCs from 3 independent experiments were assessed by multi-color FACS and statistical significance evaluated by one way ANOVA using Bonferroni´s post test for multiple comparisons.
Figure 4. A to G Increased expression of pro-inflammatory cytokines in DCs exposed to opsonized swollen ∆pksP and fks1tetOnrep conidia. fkstetOnrep skewed DCs into polarizing inflammatory Th1 and Th17 by induction of increased IL1B (a), IL6 (b), IL12A (c) and IL23A (d) mRNA (expression and the Th1-priming capacity of DCs was abrogated in presence of complement fragments on the surface of this mutant (c). Further, we found that lack of melanin also elevated IL12A (c) and IL23A (d) mRNA expression, but showed only marginal induction of IL1B (a) or IL6 (b) mRNA expression. WT conidia induced slight but non-significant elevations of the pro-inflammatory cytokines compared to non-treated iDCs. LPS-treated DCs served as positive controls for stimulating pro-inflammatory cytokines in DCs (a to d). IL10 (f) and TGFB (g) mRNA levels were only slightly changed compared to iDCs, while IL4 (e) mRNA levels were up-regulated to some extent in DCs exposed to the WT strains, but down-modulated by ∆pksP and fkstetOnrep or complement-opsonization (e). The summary of 3 independent experiments are demonstrated. Significances were evaluated by one way ANOVA using Bonferroni´s post test for multiple comparisons.
Figure 5. Differential induction of MAPKs and NFκB in DCs upon stimulation with A.fumigatus WT and mutant strains. (a) Phosphorylation patterns of ERK1/2 (42 kDa, 44 kDa), p38 MAPK (40 kDa) and NFκB in DC lysates after 1h exposure to non- and C-opsonized fungal WT and mutant conidia (ratio 1:5) were analyzed by Western Blot. Non-stimulated iDCs were used as negative, LPS-exposed DCs as positive controls for DC stimulation. We found that DCs exposed to fks1tetOnrep and fks1tetOnrep-C mediated in particular increased p38 MAPK phosphorylation compared to WTs. ERK1/2 were also activated to higher levels compared to their WT counterparts. Using ΔpksP and ΔpksP-C ERK1/2 was activated comparable to the LPS control. p38 MAPK phosphorylation was marginal. NFκB was activated in particular by C-coating of the fks1tetOnrep. Tubulin and ERK1/2 were used as controls for protein loading. One representative Western Blot out of three and histogram plots from all donors are depicted. (b) p38 MAPK phosphorylation was assessed in lysates from DCs treated with either 10µg/ml chitin (3rd lane) or 20µg/ml galactomannan (4th lane) alone, in combination (5th lane) or SNs from AfS35 WT (6th lane), fks1tetOnind (7th lane) or fks1tetOnrep (8th lane). LPS-stimulated (2nd lane) and iDCs (1st lane) served as positive or negative controls, respectively. One representative Western Blot out of three independent experiments is demonstrated, a summary of all is shown in the histogram plot. (c) Blocking DC-SIGN most significantly reduced IL23A mRNA expression upon exposure to fks1tetOnrep compared to WT- or LPS-exposed DCs. In contrast, DCs loaded with complement-coated swollen fks1tetOnrep conidia did not show any decrease in IL23A mRNA expression upon DC-SIGN blocking. The experiment was repeated three times and one representative donor is depicted.