Figures & data
Figure 1. A) High-throughput screening for growth inhibition against APEC O78. 4,122 compounds did not impact the growth of APEC O78 (no elevated OD). B) Screening of the SMs for their effect on the AI-2 activity of APEC O78. The Vibrio harveyi BB170 AI-2 bioluminescent indicator bacteria was used to screen the cell-free culture supernatant of APEC O78. APEC cell-free culture supernatant was prepared from cultures grown in the presence of 100 μM of small molecules. Sixty nine compounds inhibited ≥ 75% of the AI-2 activity of APEC O78. AI-2 bioluminescence indicator assay was repeated four times for these 69 compounds and 10 compounds that showed highest AI-2 inhibition were selected for further studies.
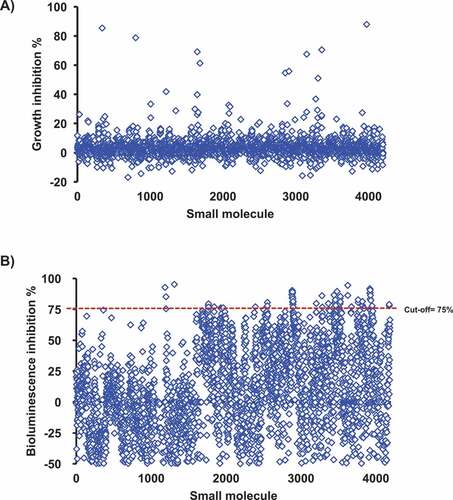
Table 1. Effect of the selected SMs on the AI-2 activity of different APEC serotypes.
Figure 2. Effect of the selected AI-2 inhibitors on; A) biofilm formation of APEC O78. Biofilm formation was assessed using crystal violet assay by measuring the OD550. All of the compounds significantly inhibited the biofilm formation except C1 in comparison to the DMSO treated control (PC). Two independent experiments were conducted with triplicate wells in each experiment and the average OD550 (black bars) and inhibition % (red dots) are shown. B) motility of APEC O78. Motility was assessed by measuring the halo on a semisolid agar. Except C9 and C10, all compounds resulted in complete inhibition (did not form detectable motility halos) in comparison to the DMSO treated control. *Significant difference between AI-2 inhibitors treated compared to DMSO treated control (P < 0.05).
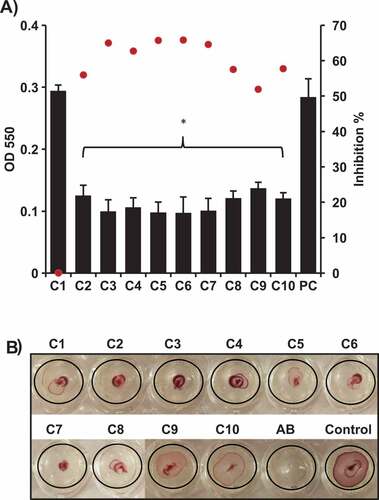
Figure 3. Cytotoxicity (A) and hemolytic activity (B) of the selected AI-2 inhibitors. Cytotoxicity was assessed using Caco-2 and HD-11 cells and hemolytic activity was determined using sheep and chicken RBCs. 100 μM of each compound was used in both assays. Most of the compounds showed significantly less cytotoxicity and hemolytic activity (P ≤ 0.05) compared to DMSO treated control. Two independent experiments were conducted with triplicate wells in each experiment and the average is shown. *Significant difference between AI-2 inhibitors treated wells compared to 10X LDH (cytotoxicity assay control) or Triton X-100 (hemolytic activity assay control).
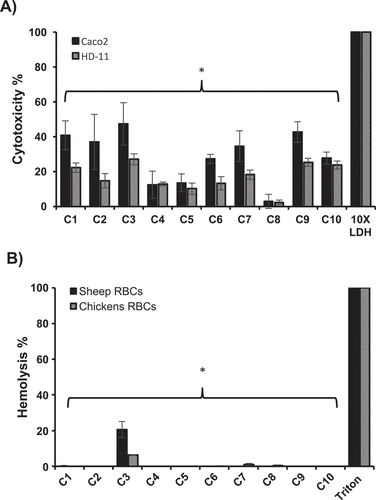
Figure 4. Effect of the AI-2 inhibitors on the intracellular survival of different APEC O78, O2, and O1 in HD-11 (A) and THP-1 (B) cells. Cells were infected with APEC strains at MOI = 100, treated for 6 h with 1 µL (100 µM) of each compound and the internalized bacteria were determined. Two independent experiments were conducted with triplicate wells in each experiment and the average is shown. *Significant difference between AI-2 inhibitors treated cells (P < 0.05) compared to DMSO treated control. **Significant difference between AI-2 inhibitors treated cells (P < 0.001) compared to DMSO treated control.
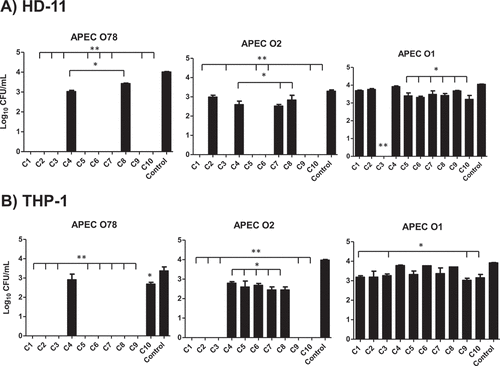
Figure 5. Effect of the AI-2 inhibitors on G. mellonella larvae infected with APEC O78; A) survival rate of the treated larvae, B) bacterial load in dead larvae at different time points (24, 48, 72 h) and in live larvae at 72 h, and C) toxic effect of each compound on G. mellonella larvae. The larvae were treated with the AI-2 inhibitors (12.5 µg/larva) and inoculated with APEC O78 (8.5 µL ~ 4.25 × 10⁴ CFU), survival monitored for 72 h. The results of two independent experiments were averaged. Significant difference between AI-2 inhibitors treated compared to DMSO treated control at 48 ha and 72 hb (P < 0.05).
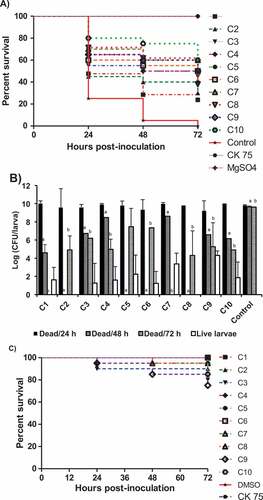
Table 2. Real Time PCR Primers used in this study.
Figure 6. Effect of the AI-2 inhibitors on expression of QS and virulence-associated genes; A) Heat map showing the impact of the selected AI-2 inhibitors on gene expression of QS and virulence associated genes. Effect on gene expression was assessed using 100 µM of AI-2 inhibitors. Three independent experiments were conducted and the average fold change was calculated using ∆∆ct. Fold changes ± 1.5 ≥ or ≤ 1.5 were considered differentially expressed. B) Principal component analysis (PCA) of the qRT-PCR data. Numbers above the arrows indicate the correlation (r) between the AI-2 inhibitors based on the gene expression data. The PCA analysis is based on the fold change of gene expression data.
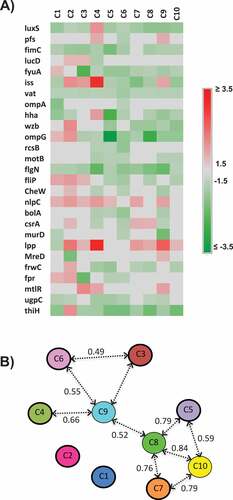
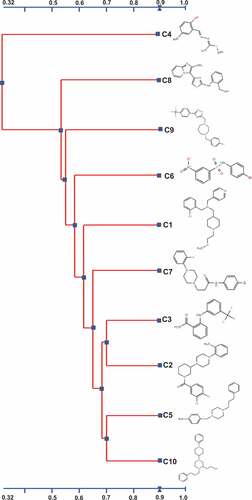
Figure 7. Alignment and the chemical structures of the top 10 AI-2 inhibitors using 2D Tanimoto similarity scoring method. A chemical structure similarity score of 0.68 is statistically significant at the 95% confidence interval.