
Figures & data
Figure 1. Functional analysis of recombinant L. lactis Coa and L. lactis vWbp. The activity of Coa and vWbp was evaluated by blood clotting, time required to induce plasma clotting and platelet aggregation. For blood clotting, citrated rat blood without (a) and with (b) dabigatran was infected with 107 CFU of either parent L. lactis pIL253, L. lactis Coa, L. lactis vWbp or L. lactis Coa/vWbp cells from an overnight culture and incubated 24 h at 37°C. Tubes were tilted to display blood coagulation. Data are representative of three independent experiments. To assess the time required to induce plasma clotting (c), 105 to 108 CFU of parent L. lactis pIL253, recombinant L. lactis Coa or L. lactis vWbp were incubated at 37°C with rat plasma. Tubes were tilted to assess plasma coagulation at 4, 8, 12, 24 and 36 h. Clotting values of 36 h, the maximal time of measurement, indicate that there was no clotting. Data are representative of three independent experiments. For platelet aggregation, cell-free supernatants (d) or pelleted cells (e) of parent L. lactis pIL253, or recombinant L. lactis Coa or L. lactis vWbp from overnight cultures were mixed with platelet rich plasma. Platelet aggregation was monitored by aggregometry and the maximum values of light transmission (maximal aggregation) reached over 20 min incubation were recorded. Data are expressed as mean ± standard deviation (SD) of three independent assays.
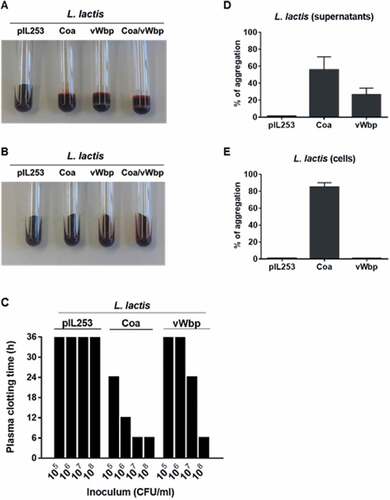
Figure 2. vWbp but not coa confers L. lactis the ability to infect pre-existing sterile valve vegetations. Infectivity titration of the L. lactis test organisms in the rat model of experimental endocarditis. The rats were challenged with bacterial inocula of gradually increasing sizes. The columns indicate the percentage of positive vegetations 24 h after bacterial challenge. The number of infected/total number of animals per group is indicated at the top of the columns. *, P < 0.05 compared with L. lactis Coa; #, P < 0.05 compared with L. lactis pIL253, as determined by the Fisher’s exact test with the Yates correction.
Figure 3. Evolution of vegetation infection after challenge with parent L. lactis pIL253 and recombinant L. lactis Coa or L. lactis vWbp (a) and in vitro killing by platelets (b). (a) Groups of 6–10 rats were inoculated with of 107 CFU and sacrificed at various times after challenge. Data represent mean ± SD of vegetation bacterial titres. *, P < 0.01 vs L. lactis pIL253 and L. lactis vWbp; # P < 0.01 vs L. lactis pIL253, as compared by the one-way ANOVA followed by Tukey’s multiple comparisons test. (b) Killing of L. lactis by platelets after 4 and 24 h of exposure. *, P < 0.05 by one-way ANOVA followed by Tukey’s multiple comparisons test.
Figure 4. vWbp does not increase L. lactis IE in the presence of clfA. Experimental endocarditis induced by inoculation of parent L. lactis pIL253 and recombinant L. lactis expressing clfA or vWbp alone or in combination. Rats with catheter-induced aortic vegetations were challenged with 104 or 105 CFU of the indicated strains. The columns express the percentage of infected vegetations 24 h after inoculation. The number of infected/total number of vegetations per group is indicated at the bottom of the columns. No significant differences (P > 0.05) were observed when infection rates and bacterial burden in vegetations were compared.
Figure 5. Neither coa nor vWbp significantly affects S. aureus Newman infectivity. Experimental endocarditis induced by inoculation of parent S. aureus Newman and isogenic mutant strains lacking coa, vwbp or clfA alone or in combination. Rats with catheter-induced aortic vegetations were challenged with 104 CFU of the indicated S. aureus Newman strains. The columns express the percentage of infected vegetations 24 h after bacterial challenge. The number of infected/total number of vegetations per group is indicated at the bottom of the columns. Statistical comparisons were determined by the Chi-square test. NS, not significant.
Table 1. Bacterial strains used in this study.