Figures & data
Table 1. Cytotoxicity against murine macrophages J774.1 and anti-Trypanosoma cruzi activity against trypomastigote and amastigote forms of indirubins.
Figure 1. Transmission electron microscopy of T. cruzi trypomastigotes incubated with indirubins for 24 h. (a) Untreated cells, scale bar: 1 μm. (B-F) After incubation with indirubins, we observed: (b) loss of cytoplasm after incubation with the EC50 concentration of the compound 10, scale bar: 0.5 μΜ, (c) dilatation of some Golgi cisternae after treatment with the EC50 concentration of the compound 32, scale bar: 0.2 μm, (d) DNA degradation with pyknotic nuclei after incubation with the EC50 concentration of the compound 11, scale bar: 0.5 μΜ, (e) DNA degradation with pyknotic nuclei after incubation with the EC50 concentration of the compound 17, scale bar: 0.2 μΜ and (f) appearance of myelin figures after incubation with the EC50 concentration of the compounds 10, 11, 17 and 32, scale bar: 0.5 μm. Black arrows indicate changes in the organelles.
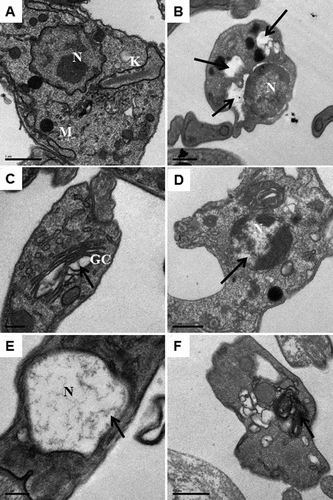
Figure 2. Scanning electron microscopy of T. cruzi trypomastigotes incubated with indirubins for 24 h. Using SEM, we observed alterations in cell shape and loss of plasma membrane integrity after treatment with the EC50 and 2 x EC50 concentration of compound 11 (B and C respectively) and (A) untreated cells. White arrows indicate the alterations reported.
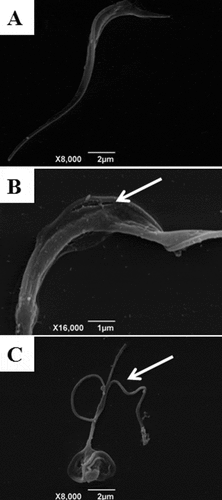
Figure 3. Flow cytometry analysis of trypomastigotes treated with indirubins 10, 11, 17 and 32 at the EC50 concentration, upon propidium iodide (PI) and annexin-V staining. (A) Untreated trypomastigotes after 24 h of incubation; (B) trypomastigotes incubated with indirubins 10, 11, 17 and 32 for 6 and 24 h.
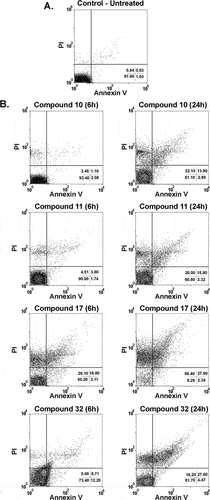
Table 2. Parasitemia and mortality in mice infected with Y Trypanosoma cruzi strain and treated daily with 20 mg/Kg of indirubins or 100 mg/Kg of benznidazole for 5 days.
Figure 4. Parasitemia and survival rate of BALB/c mice infected with T. cruzi and treated with 6-substituted indirubins. Female BALB/c mice were infected with 104 Y strain trypomastigotes. Five days after infection, mice (n = 6) were treated orally with indirubins 10, 11 and 17 (20 mg/Kg) or benznidazole (100 mg/kg) daily, during five consecutive days. (A) Parasitemia was monitored by counting the number of trypomastigotes in fresh blood samples. Values represent the mean± SEM of 6 mice per group. (B) Survival was monitored by 30 days after infection. Results are from one experiment of two performed. ** P < 0.01; *** P < 0.001 compared to untreated-infected group (vehicle).
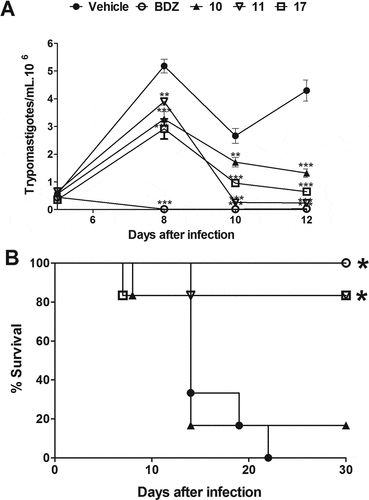
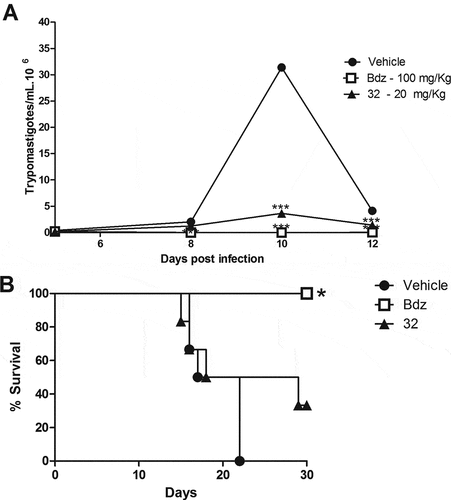
Figure 5. Parasitemia and survival rate of BALB/c mice infected with T. cruzi and treated with 7-substituted indirubin. Female BALB/c mice were infected with 104 Y strain trypomastigotes. Five days after infection, mice (n = 6) were treated orally with indirubin 32 (20 mg/Kg) or benznidazole (100 mg/kg) daily, during five consecutive days. (A) Parasitemia was monitored by counting the number of trypomastigotes in fresh blood samples. Values represent the mean± SEM of 6 mice per group. (B) Survival was monitored by 30 days after infection. Results are from one experiment of two performed. ** P < 0.01; *** P < 0.001 compared to untreated-infected group (vehicle).