
Figures & data
Figure 1. TGEV infection activated the NF-κB pathway.
(a) ST cells and IPEC-J2 cells were transfected with pNF-κB-Luc and pRL-TK. At 12 h post-transfection, cells were mock-infected or infected with TGEV at an MOI of 0.1. At 12, 24, and 36 h after TGEV infection, cell extracts were prepared for carrying out luciferase reporter gene assays. (b) ST cells and IPEC-J2 cells were transfected with pNF-κB-Luc and pRL-TK. At 24 h post-transfection, cells were infected with TGEV at an MOI of 0.001, 0.01, 0.1, or 1. Cell extracts were prepared for luciferase reporter gene assays at 36 h post-infection. Results are representative of three independent experiments. Data are presented as mean ± SD. P values < 0.05 (*) and < 0.01 (**) were considered to be statistically significant and highly significant, respectively. (c) ST cells and IPEC-J2 cells were mock-infected or infected with TGEV at an MOI of 0.1. At 36 h post-infection, cells were fixed and analyzed with the mouse anti-N and Rabbit anti-P65 antibodies, followed by TRITC-conjugated goat anti-mouse secondary antibody (red) and FITC-conjugated goat anti-rabbit secondary antibody (green). Cellular nuclei were stained with DAPI. Nuclear translocation of p65 was observed under a fluorescence microscope.
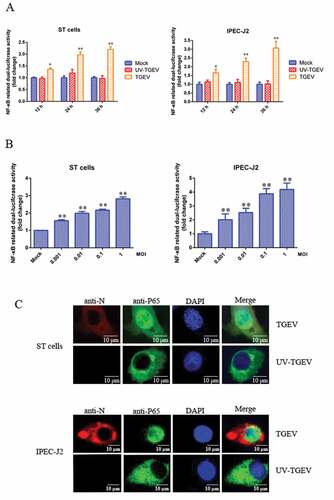
Figure 2. TGEV infection induced inflammation through the activation of the NF-κB pathway.
(a) Effects of TGEV on the NF-κB-regulated mRNA expression of IL-1β, IL-6, IL-8, and TNF-α in ST cells. ST cells were mock-infected or infected with TGEV at an MOI of 0.1. Expression levels of mRNA for IL-1β, IL-6, IL-8, and TNF-α were measured by real-time RT-PCR at 12, 24, and 36 h after TGEV infection. GAPDH and β-actin were used as internal reference genes, respectively. (b) Effects of TGEV on NF-κB-regulated mRNA expression of IL-1β, IL-6, IL-8, and TNF-α in IPEC-J2 cells. IPEC-J2 cells were mock-infected or infected with TGEV at an MOI of 0.1. Expression levels of mRNA for IL-1β, IL-6, IL-8, and TNF-α were measured by real-time RT-PCR at 36 h after TGEV infection. GAPDH and β-actin were used as internal reference genes, respectively. Values are the mean ± SD of three independent tests. P values < 0.05 (*) and < 0.01 (**) compared with mock infection group. (c) ST cells and (d) IPEC-J2 cells were infected with TGEV at an MOI of 0.1. Bay 11–7082 or QNZ was added to the media at 1 h post-infection at a final concentration of 5 μM or 10 μM, respectively. Cells treated with DMSO served as negative controls. The mRNA expression levels of IL-1β, IL-6, IL-8, and TNF-α were measured at 36 h post-infection via real-time RT-PCR. GAPDH and β-actin were used as internal reference genes, respectively. Different letters indicate significant differences (P < 0.01).
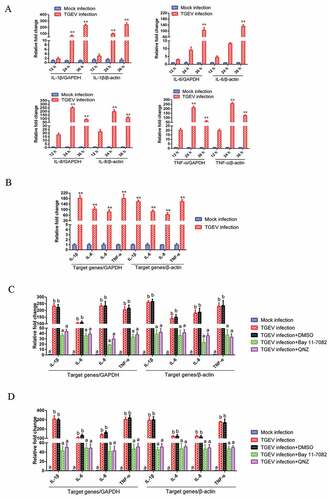
Figure 3. The effects of the NF-κB signaling pathway on TGEV replication.
ST cells were infected with TGEV at an MOI of 0.1. After 1 h, Bay 11–7082 or QNZ was added to the media at a final concentration of 5 or 10 μM, respectively. Cells treated with DMSO served as a negative control. At 12, 24, 36, 48, 60, and 72 h post-infection, the viral titers in the media were determined by the TCID50 values. Results are representative of three independent experiments. Data are presented as means ± SD. P values that were < 0.05 (*) were considered to be statistically significant.
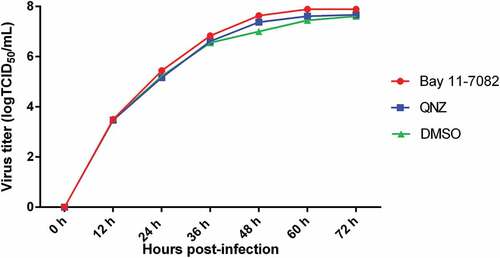
Figure 4. TGEV Nsp2 activated NF-κB.
(a) ST cells were co-transfected with pNF-κB-Luc, pRL-TK, and the indicated expression plasmid encoding the TGEV protein, or truncated segments. At 36 h post-transfection, cells were harvested and analyzed by western blotting using the anti-HA antibody and cell extracts were prepared for luciferase reporter gene assays. P values < 0.05 (*) and < 0.01 (**) were considered to be statistically significant and highly significant, respectively.(b) Increasing quantities of Nsp2 expression plasmids (0 μg, 0.5 μg, 1 μg, and 1.5 μg) were co-transfected with pNF-κB-Luc and pRL-TK into ST cells. Cells were harvested and analyzed by western blotting using the anti-HA antibody and luciferase activity measurement at 36 h post-transfection. Results are representative of three independent experiments. Data are presented as mean ± SD values. P values < 0.05 (*) and < 0.01 (**) were considered statistically significant and highly significant, respectively.
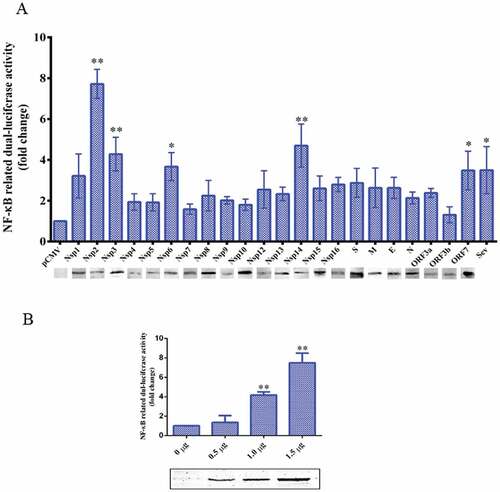
Figure 5. TGEV Nsp2 induced the degradation of IκBα and the nuclear translocation of p65.
(a) ST cells were transfected with 0 μg, 1 μg, 2 μg, or 3 μg of TGEV Nsp2 expression plasmids, as indicated. The total amount of transfected DNA was kept equal by adding appropriate amounts of the empty vector. At 36 h post-transfection, cytoplasmic and nuclear extracts were prepared and subjected to western blot analysis using anti-HA antibody, antibodies specific for endogenous IκBα, p65, and phosphorylated p65 (p-p65), using β-actin and histone H as the controls. The right panel represents the quantification of the bands by densitometry, corrected by the amount of β-actin or histone H3.(b) Nsp2-HA was transiently expressed in ST cells and IPEC-J2 cells,respectively. At 36 h post-transfection, the cells were fixed, permeabilized, and stained with antibodies to HA and endogenous p65, followed by TRITC-conjugated goat anti-mouse secondary antibody (red) and FITC-conjugated goat anti-rabbit secondary antibody (green). Nuclei were counterstained with DAPI (blue). The cells were imaged under a fluorescence microscope.
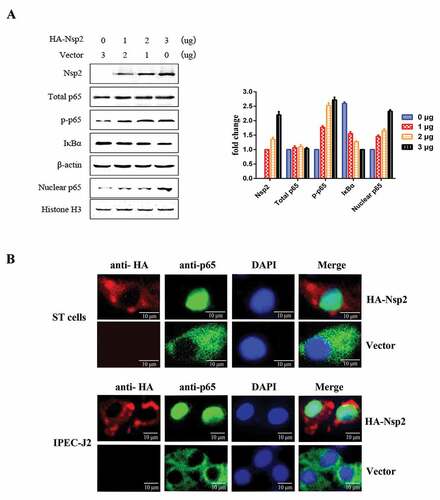
Figure 6. Nsp2 expression enhanced the expression of NF-κB-regulated pro-inflammatory genes.
ST cells (a) and IPEC-J2 (b) cells were transfected with plasmid encoding Nsp2 or the pCMV vector, respectively. After 12 h, Bay 11–7082 was added to the culture media to a final concentration of 5 μM. Cells transfected with the pCMV plasmid or treated with DMSO served as negative controls. The mRNA expression levels of IL-1β, IL-6, IL-8, and TNF-α were measured at 36 h post-transfection via real-time RT-PCR. GAPDH and β-actin were used as internal reference genes, respectively. Results are representative of three independent experiments. Data are presented as mean ± SD values. Different letters indicate significant differences (P < 0.01).
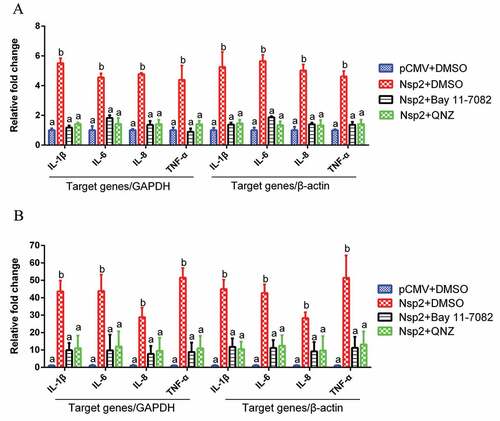
Figure 7. The amino acids 1–120 of Nsp2 were responsible for the activation of the NF-κB signaling pathway.
(a) ST cells and (b) IPEC-J2 cells were co-transfected with pNF-κB-Luc, pRL-TK, and the distinct truncated mutants of Nsp2 expression plasmids (schematic diagrams of the structure of the TGEV-truncated Nsp2 mutants are on the left of figure a and b). The empty pCMV-HA vector was used as a control. Cells were harvested and analyzed for luciferase activity at 36 h post-transfection. Results are representative of three independent experiments. Data are presented as mean ± SD values. P values < 0.05 (*) and < 0.01 (**) were considered statistically significant and highly significant, respectively.
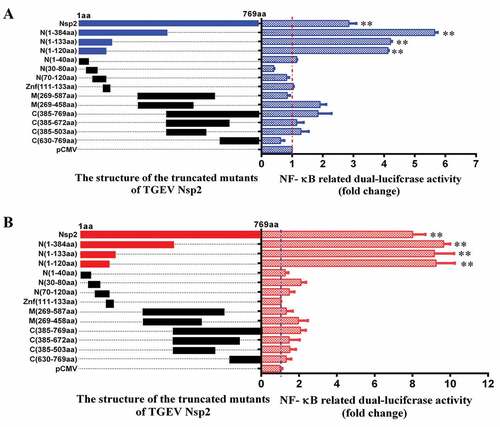
Table 1. Primers used for vector construction.
Table 2. Primers used for RT-PCR.
Supplemental material