Figures & data
Figure 1. Growth curves, plating efficiency and LptE levels of the wild type strain P. aeruginosa PAO1 and the lptE conditional mutant. (a) Stationary phase PAO1 and lptE conditional mutant (lptE) cells grown in MH with 0.5% arabinose (ARA) were diluted 1:1000 in flasks containing MH with or without 0.5% ARA (first refresh). After 24 h of growth, PAO1 and lptE cells grown in the absence of ARA were sub-cultured (dilution 1:200) in flasks in fresh medium containing or not 0.5% ARA (second refresh). As the growth curves of PAO1 with or without ARA were basically superimposable, for clarity only the curve in the absence of ARA is shown. Values are the mean (±SD) of three independent experiments. Asterisks indicate the time-points at which the growth of lptE without ARA was significantly different from that of other samples (P < 0.05, Kruskal-Wallis) (b) Western blot analysis to quantify LptE levels in whole cell lysates (20 µg of proteins; neat), or serial 1:2 dilutions as indicated, from PAO1 or lptE conditional mutant cells grown for 14 h in MH with or without ARA for one or two passages (lptE 2nd). Filters were developed with Cyanagen Westar ηC Ultra 2.0 reagent and visualized in a Odissey system (Li-Cor) system. (c) Colony growth of PAO1 and lptE on MH agar plates supplemented or not with ARA. Exponential phase cultures in MH with 0.5% ARA were normalized to OD600 = 1 in saline, and 5 μL of the 10−2–10−6 dilutions were spotted onto the plates and incubated for 20 h at 37°C. Images in panels B-C are representative of at least three experiments giving similar results.
Figure 2. Effect of LptE depletion on cell envelope stability. Lytic effect of different SDS concentrations (0–5%), measured as decrease in cell suspension turbidity (OD600), on PAO1 and lptE conditional mutant cells grown in the presence and/or absence of 0.5% arabinose (ARA), corresponding to the first (lptE) or second refresh (lptE 2nd) described in the legend of . As control, LptH-deficient cells (lptH), obtained through the culturing strategy described in Fig. S6, were included in the analysis. Values are the mean (±SD) of three independent experiments performed in duplicate.
Figure 3. Phase contrast and fluorescence microscopy images of P. aeruginosa wild type PAO1, lptH and lptE conditional mutant cells grown in MH without arabinose, and stained with the membrane-binding dye FMTM 5–95. lptE 2nd corresponds to cells cultured for two subsequent passages in the absence of arabinose (see the legend of for details). Images are representative of several fields (≥10) showing comparable results. Scale bar: 3 µm.
Table 1. Antibiotic susceptibility of lpt mutant strains by the Kirby-Bauer disk diffusion testa.
Figure 4. Localization and quantification of LPS. (a) Membrane fractionation of wild type PAO1, lptH and lptE conditional mutants. PAO1 and the lptE conditional mutant (lptE) were cultured in MH with or without 0.5% arabinose (ARA) as described in the legend to . The sample lptE 2nd corresponds to the lptE mutant pre-cultured in the absence of ARA (second refresh in ). PAO1 and lptE cells were collected for membrane fractionation when the cultures reached an OD600 = 0.8. As control, LptH-deficient cells (lptH), obtained through the culturing strategy described in Fig. S6, were included in the analysis. Membranes were fractionated by sucrose density gradient, and the different fractions were immunoblotted using antibodies against the IM protein XcpY, the OM protein OprI or LPS, as indicated on the right of each blot. Fractions corresponding to the IM or OM on the basis of the results obtained with the wild type PAO1 are indicated on the top of the figure. Images are representative of two experiments giving similar results. (b) Quantification of KDO in the above-mentioned strains cultured as described in panel A. Values are the mean (± SD) of three independent experiments. The asterisk indicates a statistically-significant decrease with respect to all other samples (P < 0.05, Kruskal-Wallis).
Figure 5. MALDI-TOF analysis of lipid A extracted from wild type (PAO1) and lptE mutant cells cultured in MH with or without 0.5% arabinose (ARA). lptE 2nd corresponds to the lptE conditional mutant cultured for two subsequent passages in the absence of ARA (see the legend of for details). Spectra were obtained in the ion negative mode, thus m/z values correspond to (molecular mass – 1)/1. Spectra are representative of three biological replicates. Relevant lipid A forms are shown with cartoons: m/z = 1646, penta-acylated lipid A; m/z = 1616, hexa-acylated lipid A; m/z = 1684, penta-acylated lipid A with the addition of a palmitoyl group (in blue). Asterisks indicate lipid A forms that vary due to the removal (m/z −16) or addition (m/z + 16) of a hydroxyl group to the secondary C12 acyl chains. The chemical structures of the identified lipid A forms are shown in Fig. S9.
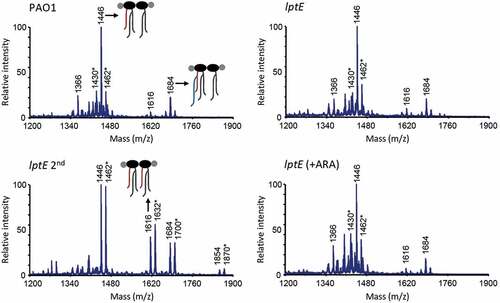
Figure 6. LptD levels in LptE-depleted cells. Total membrane samples were obtained from PAO1 lptD-6his and lptE lptD-6his cells grown as described in the legend of . Cells were collected at OD600 = 0.8, both for the first (lanes 1) and the second refresh (lanes 2). Total membrane proteins corresponding to an OD600 = 1.6 were loaded in each lane. Filters were immunoblotted using antibodies raised against the 6His tag to detect LptD-6His, against LptE, or against XcpY, as indicated on the right of each blot. To analyze the oxidation state of LptD (red, reduced; ox, oxidized), membrane samples were treated with SDS loading buffer containing (lower panel) or not 5% β-mercaptoethanol (upper panel). Images are representative of three independent experiments giving similar results.
Figure 7. Effect of LptE depletion on P. aeruginosa virulence in G. mellonella. Survival curves of G. mellonella larvae infected with different doses of P. aeruginosa PAO1 or the lptE conditional mutant cultured in MH with 0.5% arabinose (PAO1 and lptE) or in MH without arabinose (lptE 2nd). Ten larvae were infected with each infecting dose in at least three independent experiments. LD90 and R2 values for each curve are shown.