
Figures & data
Figure 1. Overview of predicted coiled-coil domain (CCD) and the different constructed mutants. Upper panel shows part of the YopN central region with putative CCM series. Middle panel shows the mutant substitutions constructed, YopNGAGA and YopNV83P, to disrupt the putative CCD. YopNRARA and YopNSASA are similar to YopNGAGA., with Arg (YopNRARA) and Ser (YopNSASA) instead of Gly substitutions. Lower panel shows CCD predictions of wt YopN and YopNGAGA.
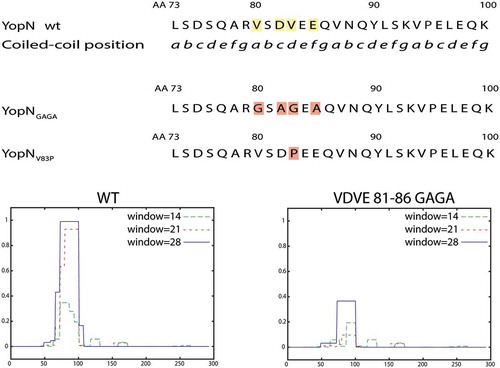
Figure 2. Characterization of the different yopN mutants. Yersinia strains expressing the different yopN mutants were grown at 37°C for 3 h in either BHI +Ca+2 (non-inducing condition) or BHI – Ca+2 (inducing conditions). Whole culture samples (expression) or filtered supernatants precipitated with trichloroacetic acid (TCA) (secretion) were subjected to SDS-PAGE. Expression (a) and secretion (b) of the different YopN variants carrying an HA tag visualized by Western blotting using anti-HA antibody. Total expression of Yops visualized by Western blotting using total-Yop-antisera (c); and secretion of Yops visualized by Coomassie blue staining (d). Analysis of YopH translocation (E). YopH-Bla fusions were introduced instrains expressing the different yopN mutants. Translocation into infected HeLa cells was determined after 30 min by measuring green and blue fluorescence. Translocation levels were calculated as the ratio of blue:green signal after subtracting background signals. The results shown are from 4 independent experiments done as triplicates and normalized to pYopN-HA. The average values ± standard errors of the means (SEM) from 4 independent experiments are shown. All test samples were compared to pYopN using one-way ANOVA followed by the Bonferroni posttest; ****, P < 0.0001.
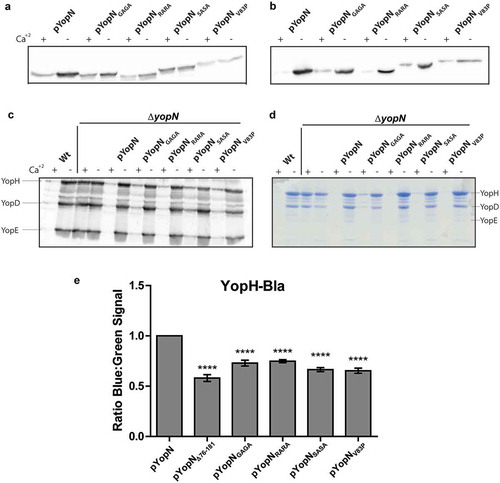
Figure 3. Translocation of the different yopN mutants. Translocation was determined using plasmids expressing C-terminal Bla fusions of the different Yop mutant proteins. These strains were used to infect HeLa cells for 30 min and YopN translocation levels were calculated as the ratio of blue:green fluorescence after subtracting background. The results shown are from 3 independent experiments performed in triplicates and normalized to infection with the strain expressing pYopN-Bla. The mean values ± SEM from 3 independent experiments are shown. All test samples were compared to the ΔyopB mutant strain expressing pYopN-Bla using one-way ANOVA followed by the Bonferroni posttest; ns, nonsignificant.
Figure 4. Yop expression and secretion in strains expressing YopN variants in cis. (a) The different strains were grown in 37°C for 3 h in either BHI +Ca+2 (non-inducing conditions) or BHI – Ca+2 (inducing conditions). Filtered supernatants were precipitated with TCA were subjected to SDS-PAGE and secreted proteins were visualized by Coomassie blue staining. (b) The different strains were grown in BHI+Ca+2 for 1 h at 37°C before depleting Ca+2 to induce the T3SS. After the induction for 30 min, whole cell samples were directly analysed for Yop expression and filtered supernatants were precipitated with TCA and then analysed for Yop secretion by western blotting using total Yop antisera. (c) Secreted YopH levels were quantified by PTPase assay. Strains were grown as in (b) and and PTPase activity in supernatants was analysed as described in materials and methods. 1 unit is equal to 1 mole of product produced per (min x ml supernatant x bacterial OD660). The results shown are from 3 independent experiments measured as triplicates. The average values ± SEM from 3 independent experiments are shown. The samples were analysed by Mann-Whitney test, ns, non-significant.
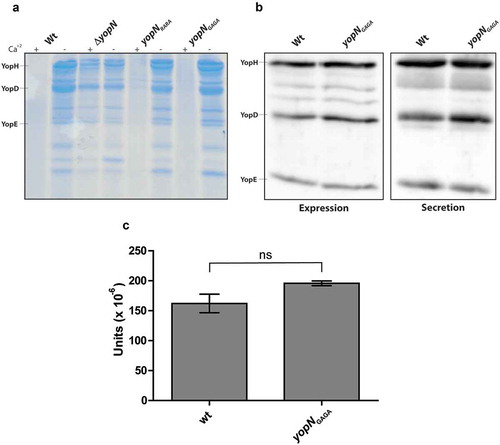
Figure 5. YopH and YopE translocation in strains expressing YopNGAGA in cis. YopH-Bla (a) or YopE-Bla (b) were introduced into wt, ΔyopB and yopNGAGA strains. HeLa cells were infected with the different strains for 30 min. Translocation levels were calculated as the ratio of blue:green signals after subtracting background levels. The results shown are from 3 independent experiments done as triplicates and normalised to cells infected with the wt strain. The mean values ± SEM from 3 independent experiments are shown. yopNGAGA samples were compared to wt using one-way ANOVA followed by the Bonferroni posttest; ***, P < 0.001.; ****, P < 0.0001.
Figure 6. Infection of BALB/c mice with bioluminescent Yersinia wt and yopNGAGA mutant. The infection was monitored using bioluminescent imaging for up to 16 days post infection (p.i.). (a) At each of days 3 and 5 p.i. one mouse infected with wt and one mouse infected with yopNGAGA were sacrificed. In all these mice, bacterial luminescence was measured from dissected liver (L), mesenteric lymph nodes (MLN), spleen (S) and intestines (I). (b) In addition to mice sacrificed in panel (a), at each of days 8 and 16 p.i. one mouse infected with yopNGAGA were sacrificed. The table shows luminescence levels from dissected livers, MLNs and spleens at 3 and 5 days p.i for wt and 3, 5, 8 and 16days p.i. for yopNGAGA.
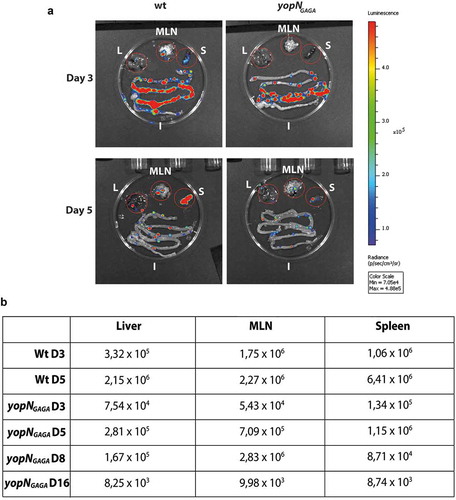
Table 1. Strains and plasmids used in this study.