3,316
Views
22
CrossRef citations to date
0
Altmetric
Research Paper

Cryptococcus neoformans and Cryptococcus gattii clinical isolates from Thailand display diverse phenotypic interactions with macrophages

, , , & ORCID Icon
Pages 26-36 | Received 25 Jun 2018, Accepted 21 Nov 2018, Published online: 12 Dec 2018

Figures & data

Figure 1. Phagocytic uptake, intracellular load and proliferation rate of C. neoformans and C. gatii clinical isolates by macrophages.

The J774 macrophage was infected by clinical isolates of C. neoformans and C gattii at a 1:10 ratio followed by lysis at 2, 18 and 24 h postinfection to determine cryptococcal uptake at 2 h, intracellular loads (ICL) at 18 h and 24 h and intracellular proliferation rate (IPR) at 18 h and 24 h by (a – e) counting with hemocytometer and (f-j) enumerating using CFU assay. Each dot represents one clinical isolate. Results were expressed as the mean of 3 to 6 experimental repeats. Error bars denote mean ± SD. Significance was determined using unpaired t test (2-tailed) * p <0.05, ** p <0.01, ns = not significantly different.
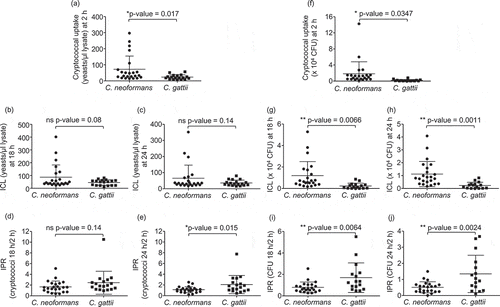
Figure 1. Phagocytic uptake, intracellular load and proliferation rate of C. neoformans and C. gatii clinical isolates by macrophages.The J774 macrophage was infected by clinical isolates of C. neoformans and C gattii at a 1:10 ratio followed by lysis at 2, 18 and 24 h postinfection to determine cryptococcal uptake at 2 h, intracellular loads (ICL) at 18 h and 24 h and intracellular proliferation rate (IPR) at 18 h and 24 h by (a – e) counting with hemocytometer and (f-j) enumerating using CFU assay. Each dot represents one clinical isolate. Results were expressed as the mean of 3 to 6 experimental repeats. Error bars denote mean ± SD. Significance was determined using unpaired t test (2-tailed) * p <0.05, ** p <0.01, ns = not significantly different.

Figure 2. Association of the cryptococcal uptake of C. neoformans and C. gattii clinical isolate with intracellular load and proliferation within macrophages.

C. neoformans and C. gattii clinical isolates were independently exposed to J774 macrophages and followed by determining the uptake rate, intracellular loads (ICL) and intracellular proliferation rate (IPR) at 24 h postinfection. The correlation between uptake rate and ICL of C. neoformans (a) or of C. gattii (b) clinical isolates was evaluated. The uptake rate of C. neoformans (c) or of C. gattii (d) was also assessed for the correlation to IPR. Spearman’s rank test was used to determine the correlation between the uptake rate, ICL and IPR. Correlation coefficients (r) and p-values were given for each correlation. * p <0.05, ** p <0.01, *** p <0.001 and ns = not significantly correlated.
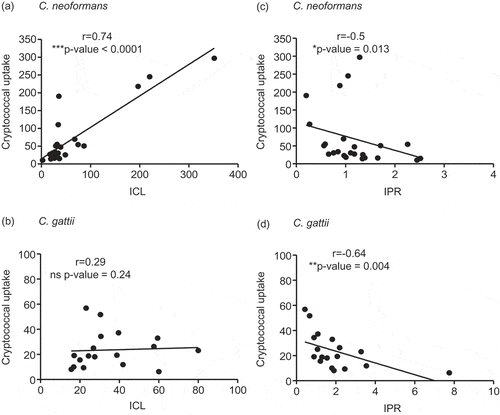
Figure 2. Association of the cryptococcal uptake of C. neoformans and C. gattii clinical isolate with intracellular load and proliferation within macrophages.C. neoformans and C. gattii clinical isolates were independently exposed to J774 macrophages and followed by determining the uptake rate, intracellular loads (ICL) and intracellular proliferation rate (IPR) at 24 h postinfection. The correlation between uptake rate and ICL of C. neoformans (a) or of C. gattii (b) clinical isolates was evaluated. The uptake rate of C. neoformans (c) or of C. gattii (d) was also assessed for the correlation to IPR. Spearman’s rank test was used to determine the correlation between the uptake rate, ICL and IPR. Correlation coefficients (r) and p-values were given for each correlation. * p <0.05, ** p <0.01, *** p <0.001 and ns = not significantly correlated.

Figure 3. Mice infected with high-uptake C. neoformans isolates exhibited higher brain fungal burdens and had reduced survival rate.

C. neoformans isolates were selected to represent the top 4 high-uptake and bottom 4 low-uptake strains and C. gattii isolates were selected to represent the top 4 high IPR and bottom 4 low IPR strains based on J774 macrophage uptake and IPR profiles. (a-d) BALB/c mice were intranasal infected with high- (HU) and low- (LU) uptake C. neoformans isolates or high (HIPR) and low IPR (LIPR) C. gattii isolates. Lung and brain fungal burdens of mice infected with C. neoformans (a, b) and C. gattii (c, d) were enumerated at 14 d postinfection. Graphs depict mean ± SD and are representative of 3 experiments with 3 to 5 mice per group. Significance was determined using unpaired t test (2-tailed) ** p <0.01, ns = not significantly different. (e) For survival analysis, BALB/c mice were infected with the high- (HU, solid line) or low- (LU, dot line) uptake strain of C. neoformans and were monitored for their survival daily for 60 d. Survival curves were generated from the results obtained with 8 mice per strain and evaluated for statistical significance with Kaplan-Meier survival curves, and P values were obtained from a log-rank test, ** p <0.01.
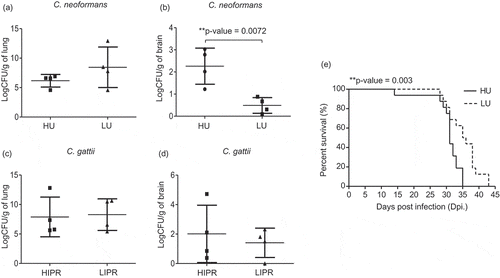
Figure 3. Mice infected with high-uptake C. neoformans isolates exhibited higher brain fungal burdens and had reduced survival rate.C. neoformans isolates were selected to represent the top 4 high-uptake and bottom 4 low-uptake strains and C. gattii isolates were selected to represent the top 4 high IPR and bottom 4 low IPR strains based on J774 macrophage uptake and IPR profiles. (a-d) BALB/c mice were intranasal infected with high- (HU) and low- (LU) uptake C. neoformans isolates or high (HIPR) and low IPR (LIPR) C. gattii isolates. Lung and brain fungal burdens of mice infected with C. neoformans (a, b) and C. gattii (c, d) were enumerated at 14 d postinfection. Graphs depict mean ± SD and are representative of 3 experiments with 3 to 5 mice per group. Significance was determined using unpaired t test (2-tailed) ** p <0.01, ns = not significantly different. (e) For survival analysis, BALB/c mice were infected with the high- (HU, solid line) or low- (LU, dot line) uptake strain of C. neoformans and were monitored for their survival daily for 60 d. Survival curves were generated from the results obtained with 8 mice per strain and evaluated for statistical significance with Kaplan-Meier survival curves, and P values were obtained from a log-rank test, ** p <0.01.

Figure 4. Infection with high-uptake C. neoformans strains induced alveolar macrophages with higher expression of genes related to M2 macrophage.

BALB/c mice received PBS or were infected with the top 4 high-and the top 4 low-uptake C. neoformans isolates. (a) Alveolar macrophages were isolated from the bronchoalveolar lavage of each mouse at 14 d postinfection and total RNA was isolated and subjected to cDNA synthesis, followed by real-time PCR analysis of gene for M1 and M2 including Arg1, Fizz1, Ym1, Il13, Ccl17, Nos2, Ifng, Il6, Tnfa, Mcp1, Csf2 and Ip10. Data were expressed as fold induction over actin (Actb) expression, with the mRNA levels in the PBS control set as 1. (b) Bronchoalveolar lavages of PBS-treated mice and high-uptake and low-uptake C. neoformans-infected mice were collected and the arginase enzyme activity was determined by photometric measurement of produced urea concentration. Graphs depict mean ± SD and are representative of 3 experiments with 3 to 5 mice per group. Significance was determined by one-way ANOVA with Tukey’s post hoc analysis * p <0.05, ** p <0.01, ***p <0.001.
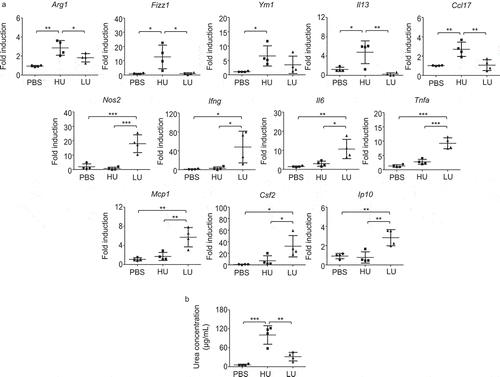
Figure 4. Infection with high-uptake C. neoformans strains induced alveolar macrophages with higher expression of genes related to M2 macrophage.BALB/c mice received PBS or were infected with the top 4 high-and the top 4 low-uptake C. neoformans isolates. (a) Alveolar macrophages were isolated from the bronchoalveolar lavage of each mouse at 14 d postinfection and total RNA was isolated and subjected to cDNA synthesis, followed by real-time PCR analysis of gene for M1 and M2 including Arg1, Fizz1, Ym1, Il13, Ccl17, Nos2, Ifng, Il6, Tnfa, Mcp1, Csf2 and Ip10. Data were expressed as fold induction over actin (Actb) expression, with the mRNA levels in the PBS control set as 1. (b) Bronchoalveolar lavages of PBS-treated mice and high-uptake and low-uptake C. neoformans-infected mice were collected and the arginase enzyme activity was determined by photometric measurement of produced urea concentration. Graphs depict mean ± SD and are representative of 3 experiments with 3 to 5 mice per group. Significance was determined by one-way ANOVA with Tukey’s post hoc analysis * p <0.05, ** p <0.01, ***p <0.001.

Figure 5. High-uptake C. neoformans potentiated the induction of type 2 immune responses and reduced type-17 immune responses in the lungs.

BALB/c mice received PBS or were infected with the top 4 high-and the top 4 low-uptake C. neoformans isolates. (a) The bronchoalveolar lavages were collected and assessed for cytokine production at 14 d postinfection. (b) Lung draining lymph nodes were harvested and cell suspensions were prepared to analyze antigen-specific cytokine production. After lymph node cells were stimulated with heat-killed Cryptococcus cells for 72 h, supernatant was collected and subjected to analyze cytokines by ELISA. Graphs depict mean ± SD and are representative of 3 experiments with 3 to 5 mice per group. Significance was determined by one-way ANOVA with Tukey’s post hoc analysis * p <0.05, ** p <0.01 and *** p <0.001.
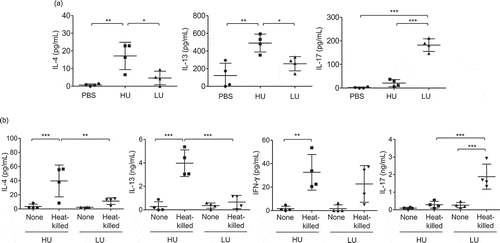
Figure 5. High-uptake C. neoformans potentiated the induction of type 2 immune responses and reduced type-17 immune responses in the lungs.BALB/c mice received PBS or were infected with the top 4 high-and the top 4 low-uptake C. neoformans isolates. (a) The bronchoalveolar lavages were collected and assessed for cytokine production at 14 d postinfection. (b) Lung draining lymph nodes were harvested and cell suspensions were prepared to analyze antigen-specific cytokine production. After lymph node cells were stimulated with heat-killed Cryptococcus cells for 72 h, supernatant was collected and subjected to analyze cytokines by ELISA. Graphs depict mean ± SD and are representative of 3 experiments with 3 to 5 mice per group. Significance was determined by one-way ANOVA with Tukey’s post hoc analysis * p <0.05, ** p <0.01 and *** p <0.001.
Supplemental material

Supplemental Material

Download MS Word (72.4 KB)