Figures & data
Figure 1. Cpx signalling influences the expression of RovM in Y. pseudotuberculosis. Steady state levels of accumulated RovM was analysed in protein pools sampled from bacteria grown in LB (A) or RPMI (B) media at 26°C until late stationary phase. Protein samples were separated on a 12% acrylamide SDS-PAGE followed by western immunoblot and detection with polyclonal rabbit antiserum raised against RovM. As a protein loading control, samples were also probed with antiserum specific for the cytoplasmic molecular chaperone DnaJ. The indicated immunoblots stem from one independent experiment. The molecular weights shown in the parenthesis are deduced from primary sequence. Strains: parent, YPIII/pIB102; parent/empty vector, YPIII/pIB102, pWKS30; rovM null mutant, YPIII171/pIB102; cpxA null mutant, YPIII07/pIB102; cpxA null mutant/empty vector, YPIII07/pIB102, pWKS30; cpxA null mutant/pcpxA+, YPIII07/pIB102, pJF067; cpxR null mutant, YPIII08/pIB102; cpxR null mutant/empty vector, YPIII08/pIB102, pWKS30; cpxR null mutant/pcpxR+, YPIII08/pIB102, pJF068. ImageJ software was used to quantify from five independent experiments the levels of RovM relative to the levels of DnaJ. Results from this analysis are represented in a scatter plot with each dot indicating data derived from a single independent experiment. The mean value from all independent experiments is indicated by a red line. Differences with a P value of < 0.01 or < 0.001 were considered significantly different from parent and are indicated by a blue-coloured double (**) or triple (***) asterisk situated immediately above the respective data points on the scatter plot.
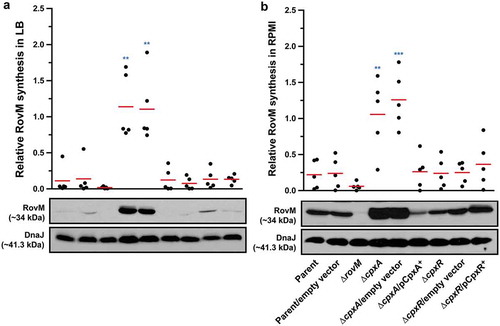
Figure 2. Accumulation of CpxR~P in the cytoplasm of Yersinia. The Phos-tag acrylamide system was used to measure accumulated CpxR~P in vivo. Bacteria were cultured at 26°C until late stationary phase in LB (A) or RPMI (B) media. After harvesting by centrifugation, bacteria were lysed with formic acid and samples immediately fractionated on Phos-tag acrylamide, immunoblotted, and detected with anti-CpxR antiserum. The cytoplasmic molecular chaperone DnaJ served as a loading control. Strains: parent, YPIII/pIB102; rovM null mutant, YPIII171/pIB102; cpxA null mutant, YPIII07/pIB102; cpxA null mutant/pcpxA+, YPIII07/pIB102, pJF067; cpxR null mutant, YPIII08/pIB102; cpxR null mutant/pcpxR+, YPIII08/pIB102, pJF068. The double asterisk (**) reflects the active phosphorylated CpxR isoform accumulated in the Yersinia cytoplasm, while the single asterisk (*) indicates the accumulated inactive non-phosphorylated CpxR isoform.
Figure 3. RovM accumulation in the cytoplasm of Yersinia in the absence of the endogenous cpxR auto-amplification loop. Steady state levels of accumulated RovM was analysed in protein pools sampled from bacteria harbouring plasmid-borne cpxR variants under the control of an IPTG inducible promoter and grown in LB media at 26°C until late stationary phase. Protein samples were separated on a 12% acrylamide SDS-PAGE followed by western immunoblot and detection with polyclonal rabbit antiserum raised against RovM (arrowhead). A lower molecular weight unidentified protein that cross-reacted with the anti-RovM antibodies was used as a convenient protein loading control (arrow). The indicated immunoblots stem from one independent experiment. The molecular weight shown in the parenthesis is deduced from primary sequence. Strains: parent, YPIII/pIB102; parent/pMMB208 (empty vector), YPIII/pIB102, pMMB208; cpxA null mutant, YPIII07/pIB102; cpxR null mutant, YPIII08/pIB102; cpxR null mutant/pMMB208 (empty vector), YPIII08/pIB102, pMMB208; cpxR null mutant/pCpxRWT+, YPIII08/pIB102, pKEC021; cpxR null mutant/pCpxRD51A+, YPIII08/pIB102, pJF015. ImageJ software was used to quantify from three independent experiments the levels of RovM relative to the levels of the lower molecular weight band cross-reacting with anti-RovM antibodies. Results from this analysis are represented in a scatter plot with each dot indicating data derived from a single independent experiment. The mean value from all independent experiments is indicated by a red line. Differences with a P value of < 0.05 or < 0.001 were considered significantly different from parent and are indicated by a blue-coloured double (*) or triple (***) asterisk situated immediately above the respective data points on the scatter plot.
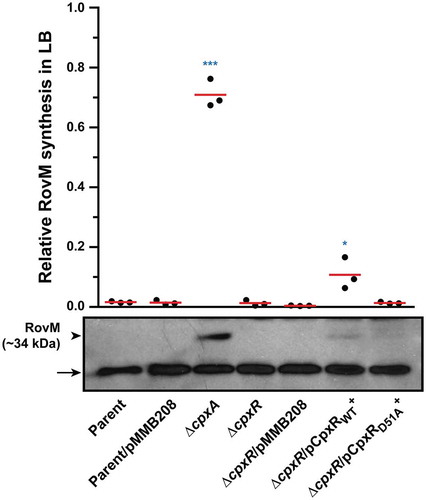
Figure 4. Accumulation of CpxR~P in the cytoplasm of Yersinia in the absence of the endogenous cpxR auto-amplification loop. The Phos-tag acrylamide system was used to measure accumulated CpxR~P in vivo. Bacteria harbouring plasmid-borne cpxR variants under the control of an IPTG inducible promoter were cultured at 26°C until late stationary phase in LB media. After harvesting by centrifugation, bacteria were lysed with formic acid and samples immediately fractionated on Phos-tag acrylamide, immunoblotted, and detected with anti-CpxR antiserum. The cytoplasmic molecular chaperone DnaJ served as a loading control. Strains: cpxR null mutant, YPIII08/pIB102; cpxR null mutant/pMMB208 (empty vector), YPIII08/pIB102, pMMB208; cpxR null mutant/pCpxRWT+, YPIII08/pIB102, pKEC021; cpxR null mutant/pCpxRD51A+, YPIII08/pIB102, pJF015. The double asterisk (**) reflects the active phosphorylated CpxR isoform accumulated in the Yersinia cytoplasm, while the single asterisk (*) indicates the accumulated inactive non-phosphorylated CpxR isoform.
Figure 5. Transcription of rovM and rovA in Y. pseudotuberculosis. For transcriptional analysis of cpxP (A), rovM (B) and rovA (C), quantitative RT-PCR was performed on mRNA isolated from Y. pseudotuberculosis strains cultured at 26°C until late stationary phase in LB and RPMI media. Each sample was normalised against the mean cycle threshold of rpoA for that sample. Results are represented in a scatter plot with each dot indicating data derived from a single independent experiment. The mean value from all independent experiments is indicated by a red line. Differences with a P value of <0.05, < 0.01 or < 0.001 were considered significantly different from parent and are indicated by a blue-coloured single (*), double (**) or triple (***) asterisk situated immediately above the respective data points on the scatter plot. Strains: parent, YPIII/pIB102; rovM null mutant, YPIII171/pIB102; cpxA null mutant, YPIII07/pIB102; cpxA null mutant, rovM(Mt. 1), YPIII177/pIB102; cpxA null mutant, rovM(Mt. 2), YPIII179/pIB102; cpxA null mutant, rovA(Mt. 2), YPIII183/pIB102; cpxA null mutant, rovM(Mt. 1), rovA(Mt. 2), YPIII181/pIB102; cpxA null mutant/pcpxA+, YPIII07/pIB102/pJF067; cpxR null mutant, YPIII08/pIB102; cpxR null mutant/pcpxR+, YPIII08/pIB102/pJF068.
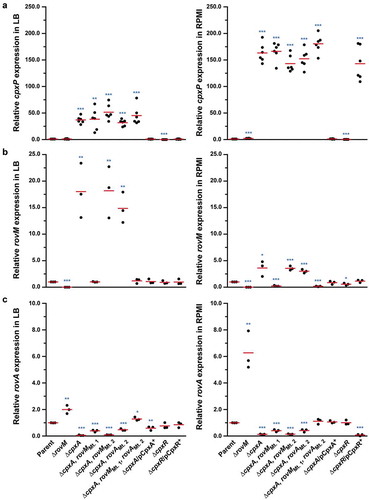
Figure 6. Mapping the CpxR~P DNA binding site upstream of rovM by nuclease protection (foot-printing) analysis. The promoter region of rovM was divided into six shorter amplified DNA segments; FP-A (−618 to −364), FP-B (−471 to −222), FP-C (−348 to −92), FP-D (−256 to −6), FP-E (−194 to +51) and FP-F (−108 to +146) (shown in ). Numbers in parentheses reflect the amount of nucleotides upstream (-) and downstream (+) of the +1 transcriptional start site. DNase I foot-printing assays were performed to investigate the binding of CpxR~P to a region within these DNA fragments of the rovM promoter. The 32P labelled FP-D (B) and FP-B (C) sense strands of parent and mutated DNA fragments were incubated with CpxR~P at the following final concentrations: 0 nM, lane a and b (indicated by “–”); 100 nM, lane c; 200 nM, lane d; 400 nM, lane e; 600 nM, lane f, 800 nM, lane g. Reactions were resolved by denaturing PAGE and analysed with a Molecular Dynamics PhosphorImager. Labelled pBR322 DNA digested with MspI (New England Biolabs) was used as a size marker (lane a). An estimation of the protected sequence is given on the right hand side of the panels. Based upon the E. coli consensus sequence of 5ʹ-GTAAA(N)4-8GTAAA-3ʹ, a putative CpxR~P consensus binding sites, box 1 and box 2, are highlighted in a grey box with the mutagenized sequence immediately to the right and labelled as Mt. 1 (for CpxR~P binding box 1 mutation) and Mt. 2 (box 2 mutation) respectively.
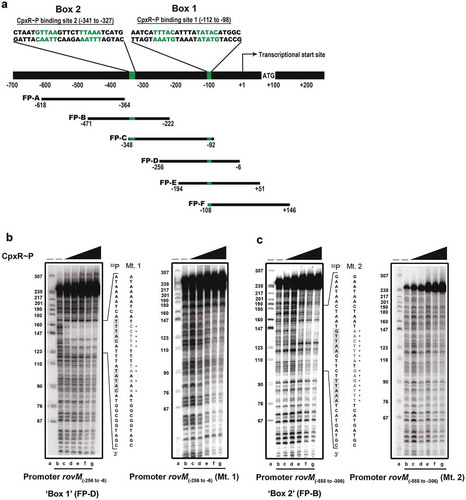
Figure 7. Mutation of the box 1 binding site effects rovM promoter responsiveness to active CpxR~P. Protein levels were analysed from lysed bacterial samples previously grown in LB (A) or RPMI (B) media at 26°C until late stationary phase. Protein samples were separated on a 12% (RovM) or 15% (RovA) acrylamide SDS-PAGE and specific proteins were identified using a western immunoblot and detection analysis with polyclonal rabbit antiserum raised against RovM and RovA. DnaJ served as a protein loading control. The indicated immunoblots stem from one independent experiment. The molecular weights shown in the parenthesis are deduced from primary sequence. Strains: parent, YPIII/pIB102; rovM null mutant, YPIII171/pIB102; cpxA null mutant, YPIII07/pIB102; cpxA null mutant, rovM(Mt. 1), YPIII177/pIB102; cpxA null mutant, rovM(Mt. 2), YPIII179/pIB102. ImageJ software was used to quantify from at least four independent experiments the levels of RovM and RovA relative to the levels of DnaJ. Results from this analysis are represented in a scatter plot with each dot indicating data derived from a single independent experiment. The mean value from all independent experiments is indicated by a red line. Differences with a P value of <0.05, < 0.01 or < 0.001 were considered significantly different from parent and are indicated by a blue-coloured single (*), double (**) or triple (***) asterisk situated immediately above the respective data points on the scatter plot.
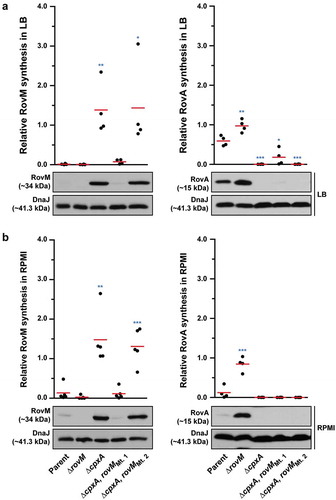
Figure 8. Contribution of RovM and CpxR~P to the steady state accumulation of RovA. Protein levels were analysed from lysed bacterial samples previously grown in LB (A) or RPMI (B) media at 26°C until late stationary phase. Protein samples were separated on a 12% (RovM) or 15% (RovA) acrylamide SDS-PAGE and specific proteins identified using western immunoblot and detection analysis with polyclonal rabbit antiserum raised against RovM (left panels) and RovA (right panels). DnaJ served as a protein loading control. The indicated immunoblots stem from one independent experiment. The molecular weights shown in the parenthesis are deduced from primary sequence. Strains: parent, YPIII/pIB102; rovM null mutant, YPIII171/pIB102; cpxA null mutant, YPIII07/pIB102; cpxA null mutant, rovM null mutant, YPIII165/pIB102; cpxR null mutant, YPIII08/pIB102; cpxR null mutant, rovM null mutant, YPIII173/pIB102. ImageJ software was used to quantify from three independent experiments the levels of RovM and RovA relative to the levels of DnaJ. Results from this analysis are represented in a scatter plot with each dot indicating data derived from a single independent experiment. The mean value from all independent experiments is indicated by a red line. Differences with a P value of <0.05, < 0.01 or < 0.001 were considered significantly different from parent and are indicated by a blue-coloured single (*), double (**) or triple (***) asterisk situated immediately above the respective data points on the scatter plot.
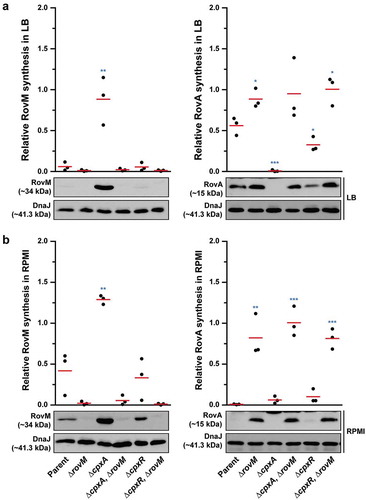
Figure 9. RovM and CpxR cooperate to establish negative control on rovA transcription. A mutation of the box 1 CpxR~P-binding site in the rovM promoter (rovM(Mt. 1)) was combined with a mutation in the CpxR~P-binding box of the rovA promoter (rovA(Mt. 2)). To analyse for RovM and RovA production, protein pools were isolated from bacteria grown in LB (A) or RPMI (B) media at 26°C until late stationary phase. Protein samples were separated on a 12% (RovM) or 15% (RovA) acrylamide SDS-PAGE and specific proteins identified using western immunoblot and detection analysis with polyclonal rabbit antiserum raised against RovM (left panels) and RovA (right panels). DnaJ served as a protein loading control. The indicated immunoblots stem from one independent experiment. The molecular weights shown in the parenthesis are deduced from primary sequence. Strains: parent, YPIII/pIB102; cpxA null mutant, YPIII07/pIB102; cpxA null mutant, rovA(Mt. 2), YPIII183/pIB102; cpxA null mutant, rovM(Mt. 1), YPIII177/pIB102; cpxA null mutant, rovA(Mt. 2), rovM(Mt. 1), YPIII181/pIB102. ImageJ software was used to quantify from at least four independent experiments the levels of RovM and RovA relative to the levels of DnaJ. Results from this analysis are represented in a scatter plot with each dot indicating data derived from a single independent experiment. The mean value from all independent experiments is indicated by a red line. Differences with a P value of < 0.01 or < 0.001 were considered significantly different from parent and are indicated by a blue-coloured double (**) or triple (***) asterisk situated immediately above the respective data points on the scatter plot.
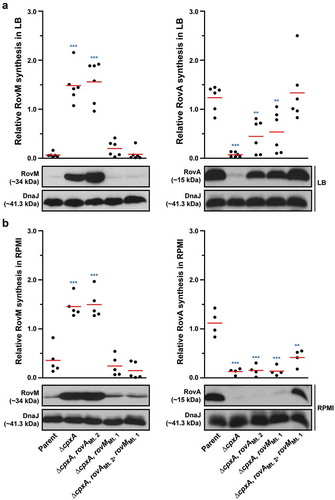
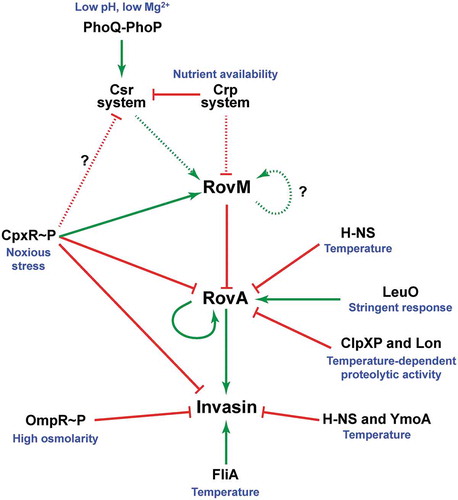
Figure 10. A scheme depicting CpxR~P influence on the CsrA-Crp-RovM-RovA regulatory cascade. The RovM-RovA regulatory pathway leading to the controlled production of several virulence determinants – including the Y. pseudotuberculosis adhesin invasin – is strictly controlled by cascade regulation at both the transcriptional and post-transcriptional levels in response to multiple environmental cues. The strongest influence on RovA production is through two opposing pathways. The first is an auto-amplification loop, which in turn is controlled by thermo-regulated proteolysis via the action of ClpXP and Lon proteases. The second is repression via RovM acting in concert with H-NS. RovM levels are principally controlled by an uncharacterised auto-activation loop and the prominent Csr and Crp pathways responsive to carbon and glucose availability. Additionally, we now show that the CpxR~P pathway responsive to extracytoplasmic (periplasmic) noxious stresses that is another critical player in this cascade regulation. Active CpxR~P isoform directly induces production of the RovM repressor, and also directly represses production of both RovA and invasin. By an uncharacterised mechanism active CpxR~P also negatively influences Csr output. Thus the net effect of CpxR~P is a significant downturn in RovA and invasin production, as well as other prominent virulence factors such as the Ysc-Yop T3SS (not shown here). In this context, it is interesting that the FliA sigma factor plays a role in the coordination of inverse regulation of invasin and the Ysc-Yop system (not shown). On this basis, a prediction would be that the regulatory events of CpxR~P and FliA are somehow connected. In the diagram, direct (filled line) or indirect (dotted line) induction events are indicated by a green arrow, while direct (filled line) or indirect (dotted line) repression events are indicated by a blunted red line.