Figures & data
Figure 1. Growth curve of Streptococcus suis ATCC 700794 in the absence of tylosin and in the presence of 1/4 MIC of tylosin. Data are expressed as means ± standard deviations.
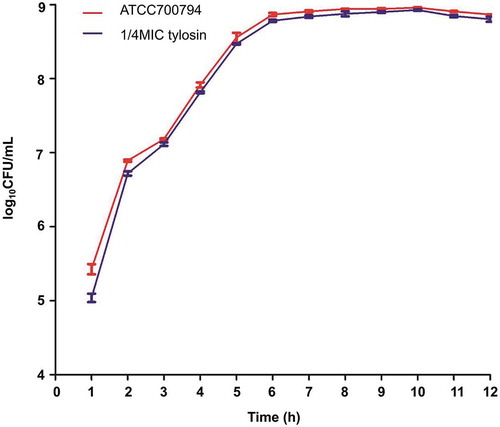
Figure 2. K-means clustering representation of 171 profiles of Streptococcus suis with up-regulations (a) and down-regulations (b). The magnitude of the percentage is represented by a color scale (top right) going from low (green) to high (red).
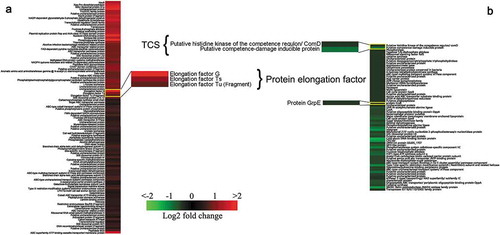
Table 1. Identification of Differentially Expressed Proteins.
Table 2. Primers used for the quantitative qRT-PCR analysis.
Figure 3. The network of significantly differentially expressed proteins (ratio>1.2 or <0.8 (p-value<0.05)) was analyzed by STRING. Small nodes represent proteins of unknown 3D structure; large nodes represent proteins with some 3D structure information or predicted. Coloured nodes represent query proteins and first shell of interactors; white nodes represent second shell of interactors. The blue lines represent database evidence; the purple lines represent experimental evidence; yellow lines represent text mining evidence; the black lines represent coexpression evidence; and green lines represent neighbourhood evidence.
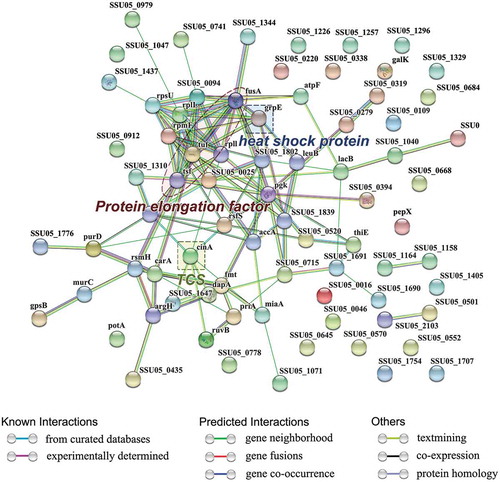
Table 3. MICs of resistance strain Streptococcus suis ATCC 700794.
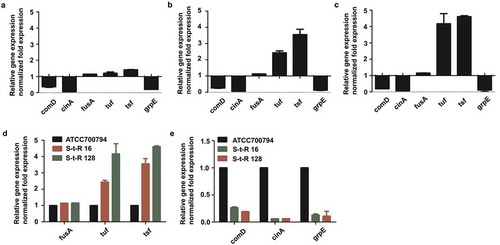
Figure 4. (a). Effect of 1/4 MIC of tylosin on mRNA expression of genes in Streptococcus suis ATCC 700794. Data are expressed as means ± standard deviations. The expression was normalized to 16S rRNA. Significantly different (*p < 0.05) compared to untreated control bacteria. (b). Effect on mRNA expression of genes in drug resistance level at 16 μg/mL of tylosin (S-t-R 16) Streptococcus suis ATCC 700794. Data are expressed as means ± standard deviations. The expression was normalized to 16S rRNA. Significantly different (*p < 0.05) compared to control bacteria. (c). Effect on mRNA expression of genes in drug resistance level at 128 μg/mL of tylosin (S-t-R 128) Streptococcus suis ATCC 700794. Significantly different (*p < 0.05) compared to untreated control bacteria. Data are expressed as means ± standard deviations. The expression was normalized to 16S rRNA. Significantly different (*p < 0.05) compared to control bacteria. (d). Effect on mRNA expression of fusA, tuf, tsf in Streptococcus suis ATCC 700794, drug resistance level at 16 μg/mL of tylosin (S-t-R 16) Streptococcus suis ATCC 700794 and drug resistance level at 128 μg/mL of tylosin (S-t-R 128) Streptococcus suis ATCC 700794. Data are expressed as means ± standard deviations. The expression was normalized to 16S rRNA. Significantly different (*p < 0.05) compared to control bacteria. (e). Effect on mRNA expression of comD, cinA, grpE in Streptococcus suis ATCC 700794, drug resistance level at 16 μg/mL of tylosin (S-t-R 16) Streptococcus suis ATCC 700794 and drug resistance level at 128 μg/mL of tylosin (S-t-R 128) Streptococcus suis ATCC 700794. Data are expressed as means ± standard deviations. The expression was normalized to 16S rRNA. Significantly different (*p < 0.05) compared to control bacteria.