Figures & data
Figure 1. LPS profile of O2 serotype-converted mutants in S. Typhimurium.
(a) The LPS profiles of the wild-type S. Paratyphi A and S. Typhimurium and mutants S1049 (Δabe::prt-tyvA1), S1071 [Δ(abe-wzxB1)::(prt-wzxA1)], S1072 (Δabe::prt-tyvA1 ΔwbaVB1:: wbaVA1) and S1074 [Δ(abe-wbaVB1)::(prt-wbaVA1)] were visualized by silver staining. (b and c) Western blot analysis confirmed the O-serotype conversion from O4 to O2. Salmonella O4 and O2 single-factor rabbit antisera were used as primary antibodies in the Western blot assay. Samples derived from the same experiment and gel/blots were processed in parallel.
![Figure 1. LPS profile of O2 serotype-converted mutants in S. Typhimurium.(a) The LPS profiles of the wild-type S. Paratyphi A and S. Typhimurium and mutants S1049 (Δabe::prt-tyvA1), S1071 [Δ(abe-wzxB1)::(prt-wzxA1)], S1072 (Δabe::prt-tyvA1 ΔwbaVB1:: wbaVA1) and S1074 [Δ(abe-wbaVB1)::(prt-wbaVA1)] were visualized by silver staining. (b and c) Western blot analysis confirmed the O-serotype conversion from O4 to O2. Salmonella O4 and O2 single-factor rabbit antisera were used as primary antibodies in the Western blot assay. Samples derived from the same experiment and gel/blots were processed in parallel.](/cms/asset/1b538660-4570-4e7f-b320-1b0fb0d6923e/kvir_a_1559673_f0001_b.gif)
Table 1. Bacterial strains and plasmids used in this study.
Table 2. Transduction efficiencies, MICs, swimming motility and virulence of wild type Salmonella and its derivatives.
Figure 2. LPS profile of the live attenuated vaccine candidates S1151 (pSS978) and S1166 (pSS978).
(a) The LPS profiles of the live attenuated vaccine candidates S1151 (Δabe ΔpagL::araC PBAD abe TT ΔrelA::araC PBAD lacI TT Δcrp Δcya Δasd) harboring pSS978 and S1166 (Δcrp Δcya ΔrelA ΔpagL Δasd) harboring pSS978 were visualized by silver staining. Vaccine candidates were grown in medium with (+) or without (-) 0.2% arabinose, as indicated. (b and c) Western blot analysis of the LPS profile from panel A probed with anti-Salmonella serogroup A single-factor O2 (anti-O2) or serogroup B single-factor O4 (anti-O4) antibodies, as indicated. Samples derived from the same experiment and gel/blots were processed in parallel.
Figure 3. Serum IgG and mucosal IgA responses against S. Paratyphi A and S. Typhimurium LPS.
The LPS of S. Paratyphi A and S. Typhimurium were used to coat ELISA plates. After a booster immunization, the serum IgG and vaginal wash IgA responses were measured by ELISA. (a) The levels of anti-S. Paratyphi A LPS IgG induced by S1112, S1151 (pSS978) and S1166 (pSS978) were significantly higher than those induced by S738 (***, P < 0.001). (b) The level of anti-S. Typhimurium LPS IgG induced by S738 was significantly higher than that induced by S1112 (***, P < 0.01), while there were no significant differences among the others. (c) Vaginal wash anti-S. Paratyphi A LPS IgA levels induced by S1112, S1151 (pSS978) and S1166 (pSS978) were significantly higher than those induced by S738 (***, P < 0.01). (D) Vaginal wash anti-S. Typhimurium LPS IgA induced by S738 was significantly higher than that induced by S1112 (***, P < 0.01). The negative control groups (BSG) did not mount a detectable immune response in any test. The concentration of antibodies was calculated using a standard curve. All concentrations of the measured samples were within the range of the standard curve. Error bars represent the standard errors of the means.
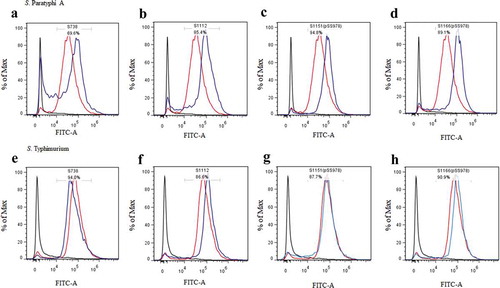
Figure 4. Flow cytometry histograms of C3 complement deposition.
The percentage of FITC-positive bacteria was determined by flow cytometry. The wild-type S. Paratyphi A was incubated with the sera from mice that had been vaccinated with S738 (a), S1112 (b), S1151 (pSS978) (c) and S1166 (pSS978) (d). Accordingly, approximately 69.6%, 85.4%, 94.8% and 89.1% S. Paratyphi A were detected positive, respectively. The wild-type S. Typhimurium was incubated with sera from mice that had been vaccinated with S738 (e), S1112 (f), S1151 (pSS978) (g) and S1166 (pSS978) (h). Accordingly, approximately 94.0%, 86.6%, 87.7%, 90.9% of S. Typhimurium were detected positive, respectively. The blue line indicated the test groups mentioned above. The negative control (black line) was the wild-type S. Paratyphi A or S. Typhimurium incubated with naïve mice serum, and the positive control (red line) was the wild-type S. Paratyphi A or S. Typhimurium incubated with O2 or O4 single-factor rabbit antisera.
Figure 5. The differential uptake of S. Paratyphi A and S. Typhimurium by RAW264.7 cells after serum opsonization.
Opsonophagocytic uptake of the wild-type S. Paratyphi A and S. Typhimurium by RAW264.7 macrophages was evaluated after treatment with the sera from mice that had been immunized with live attenuated vaccine candidates. (A) In comparison to the control (S. Paratyphi A opsonized with naïve serum), the uptake of S. Paratyphi A opsonized with sera from mice primed with S1112, S1151 (pSS978) and 1066 (pSS978) was significantly higher (**, P < 0.01). (B) The uptake of S. Typhimurium opsonized with sera from mice primed with S738, S1112, S1151 (pSS978) and S1166 (pSS978) was significantly higher than those opsonized with naïve mice serum (**, P < 0.01; ***, P < 0.001). The number of enumerated cells was normalized to 100% as the maximal value. The error bars represented the standard errors of the means.