Figures & data
Figure 1. Mucin production/transport in the mouse colon during clearance of C. rodentium infection. (a-d) Incorporated GalNAz to mouse distal colon 3 h after intraperitoneal injection, TAMRA (red) and DAPI (blue). (a) non-infected and (b) C. rodentium infected mice harvested 14 days after infection using a 20x objective, (c) close-up of goblet cells from the same non-infected and (d) infected mice using 40x objective. Arrows point to the upper part of the goblet cell theca, which in the non-infected animals is devoid of GalNAz labelled mucin, whereas in the infected mice incorporated label is abundant. (e) Quantification of the incorporated TAMRA fluorescence intensity/area in the epithelial surface and neck of the distal colon of WT mice, **p < 0.01,: Mann-Whitney U-test, n = 6–8 day 14 and 3–4 day 19. (f) Blinded visual semi-quantification of the intensity of incorporated GalNAz in goblet cells, each location received a score of 0–4 based on intensity, *p < 0.05,: Mann-Whitney U-test, n = 6–8 day 14 and 3–4 day 19. (g) Quantification of the non-reducing end GalNAc among non-infected control mice and mice infected with C. rodentium for 14 days. Released O-glycans from distal intestine were analyzed on PGC-LC-MS/MS. Molecular mass, retention time on PGC column and tandem mass spectra along with in-house tandem mass spectral glycan library were used for structural identification (n = 3).
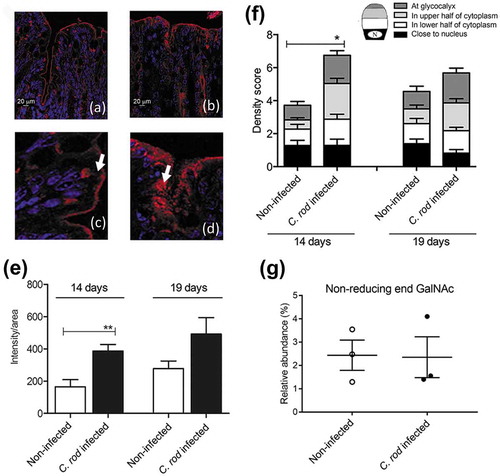
Figure 2. C. rodentium infection parameters, intracellular mucin storage and mucus thickness in WT and IFN-γ−/- mice. (a) Colony forming units (CFU) of C. rodentium were analyzed in fecal pellets collected from individual mice. Compared to the non-infected mice, the number of C. rodentium increased in both WT and IFN-γ−/- mice after infection. The CFU counts only differed between the groups at day three, and were indistinguishable at day five and 10 pi (n = day 0: IFN-γ−/- 10 and WT 4, days three and five: 3–4, day 10: IFN-γ−/- 16 and WT 4). (b) Colitis scores for WT and IFN-γ−/- mice during infection. The score is calculated from the sum of crypt architecture, increased crypt length, emptied goblet cells, leukocyte infiltration, presence of lamina propria neutrophils, crypt abscesses, and epithelial damage and ulceration (Score 0–4/parameter) (n = day 0: IFN-γ−/- 9 and WT 26, day 10: IFN-γ−/- 10 and WT 19). (c) The thickness of the inner mucus layer in distal colonic explants of WT and IFN-γ−/- mice in the non-infected animals at day 0 and 10 pi (n = IFN-γ−/- 4 and WT 7) assessed by measuring the distance between the top of the mucus layer (visualized by addition of activated charcoal particles) and the epithelial surface using a micropipette connected to a micromanipulator. D) The percentage of the mucosa positive for AB/PAS staining in the colon of the WT and IFN-γ−/- mice (n = IFN-γ−/- 9–10, WT day 0: 21 and day 10: 18). Statistics: one way ANOVA, Holm-Šídák’s post hoc test, ##p < 0.001, ###p < 0.0001 vs day 0 of the WT mice, *p < 0.05, **p < 0.01, ***p < 0.0001 vs day 0 of the IFN-γ−/- mice and &p < 0.05, &&&p < 0.0001 vs day 10 of the WT mice.
Table 1. Concentration of cytokines used to treat the in vitro model. The concentrations of the human cytokines were chosen based on previous work either related to immune response/mucin production and/or lack of detrimental effect on cell lines [Citation33–Citation38].
Figure 3. Morphology score of in vitro mucosal surfaces with and without C. rodentium, EPEC or ETEC infection. (a) Score reflecting the morphology (based on number of crypt like structures 0–4, integrity of the epithelial layer 0–4, and presence and mucus engorgement of surface goblet cells 0–4). Statistics: one way ANOVA, Dunnett’s post hoc test, *p < 0.05, **p < 0.001 and ***p < 0.0001 compared to controls in each group, and one way ANOVA, Holm-Šídák’s post hoc test, &p < 0.05, &&p < 0.001 compared to the non-infected in vitro mucosal surfaces treated with the same cytokine (n for non-infected: control 23, IFN-γ 12, TNF-α 12, IL-4 13, IL-13 11, for C. rodentium infected: control 9, IFN-γ 12, TNF- α 11, IL-4 13, IL-13 8, for EPEC infected: control 9, IFN-γ 5, TNF- α 6, IL-4 6, IL-13 5, for ETEC infected: control 5, IFN-γ 5, TNF- α 5, IL-4 5, IL-13 5), results are the mean of three experiments. B-K) AB/PAS staining of in vitro mucosal surfaces: B) Non-infected and non-treated, (c) treated with IFN-γ, (d) TNF-α, E) IL-4, (f) IL-13, (g) C. rodentium infected non-treated, (h) treated with IFN-γ, (i) TNF-α, (j) IL-4 and (k) IL-13. The in vitro mucosal surfaces were stained with Eub338 (green) and cell mask (red) to visualize bacterial localization in relation to the epithelial cells after 24 h of infection with (l) C. rodentium, (m) EPEC or (n) ETEC, nucleus stained with DAPI (blue).
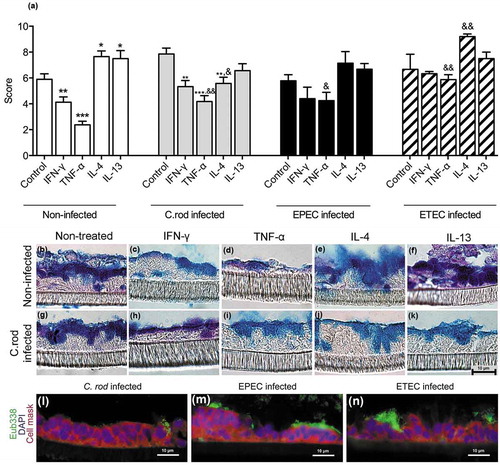
Figure 4. Combined IFN-γ and TNF-α in vitro treatment with and without addition of IL-4. The in vitro mucosal surfaces were cytokine treated for 4 days and infected for 24 h. (a) AB/PAS score: the score reflects the morphology (based on number of crypt like structures 0–4, integrity of the epithelial layer 0–4, and presence and mucus engorgement of surface goblet cells 0–4). (b, c) MUC2 and MUC5AC immunofluorescence; B) The percentage of the cells in the in vitro mucosal surfaces that were goblet cells was calculated in a blinded fashion. The white versus black parts of the bar corresponds to the proportion of the goblet cells that were positive for MUC5AC versus MUC2. Most goblet cells were positive for both mucins, although some only for one mucin. (c) Integrated fluorescence density obtained using the ImageJ program to quantify the mucins in the in vitro mucosal surface. Statistics: Wilcoxon signed rank test, *p < 0.05 (n = 3–5).
Figure 5. Mucin production and transport en route exocytosis in cytokine treated in vitro mucosal surfaces with and without infection. In vitro mucosal surfaces were harvested two h after addition of GalNAz to the basolateral media and the intensity and cellular location of incorporated label were detected by immunofluorescence. Scores for intensity and location of newly synthesized mucins were calculated as: close to nucleus (0–4), in the lower half of the cytoplasm (0–4), in the upper half of the cytoplasm (0–4) and at the cell surface (0–4) in a blinded fashion. Statistics: one way ANOVA, Dunnett’s post hoc test, *p < 0.05 and **p < 0.01 compared to control in each group, and one way ANOVA, Holm-Šídák’s post hoc test, &&p < 0.001 and &&&p < 0.0001 compared to the non-infected in vitro mucosal surfaces treated with the same cytokine (n = 3–4).
Figure 6. Expression of genes involved in mucin regulatory pathways during C. rodentium infection. (a) Changes in mRNA levels of infected WT (10, 14 and 19 dpi) and IFN-γ−/- (10 dpi) mice, expressed as mean fold change compared to non-infected controls and based on a qPCR cytokine array containing 84 mouse inflammatory cytokines, chemokines and receptor genes. The data sets for time point 0 and 10 dpi represents four mice (pooled two and two) and the time points 14 and 19 dpi are representative of three mice. The differences between the data sets (biological and technical replicates) at each time point were less than 15%. Expression data was normalized against the Gusb housekeeping gene, which was calculated to be the most stable of the five existing housekeeping genes in the array. B) Interaction network of the proteins encoded in the mRNA array that were connected to Stat6, generated by the STRING v10database (https://string-db.org). The lines connecting each node were weighted for confidence of interaction based on experimental datasets and published information. Stronger associations are represented by thicker lines. (c) mRNA levels determined by qPCR in an additional three WT mice 0 and 19 dpi. Gene expression was normalized against Hhprt and Eif2 housekeeping genes. Fold changes were calculated using ∆∆CT with the mean CT from non-infected control mice. Statistics: unpaired t-test *p < 0.05 and **p < 0.01 (n = 3).
Figure 7. Effect of IL-4 and Stat6 inhibitor treatment on colitis, serum IgG and fecal CFU in C. rodentium infected WT mice. Mice received IL-4 (0.2 µg/mouse), Stat6 inhibitor (AS1517499, 10 mg/kg body weight [Citation26]) or vehicle (sterile PBS containing 20% DMSO and 1% bovine serum albumin) by intraperitoneal injection for three consecutive days (for cohort 1: from day 11 to day 13, cohort 2: day 10 to day 12 pi). (a) Colitis scores for all treatment groups at 13 and 22 (clearance of infection ≤1000 CFUs/g feces) dpi. The score is the sum of crypt architecture, goblet cell depletion, leukocyte infiltration, presence of lamina propria neutrophils, crypt abscesses, and epithelial damage and ulceration. Results are shown from cohort 2 (n = 5–6/group and time point), and similar results were obtained from cohort 1 (n = 4–5/harvested day 14). (b) Inflammatory cell infiltration at 13 dpi (n = 5–6, cohort 2). (c) Mouse serum IgG response to C. rodentium determined by ELISA at 13 dpi (n = infected vehicle, Stat6 inhibitor and IL-4 treated 5–6, non-infected control 8). Statistics: Kruskall wallis test; *p < 0.05 vs vehicle, &p < 0.05 IL-4, ††p < 0.01 vehicle and ##p < 0.01 Stat6 inhibitor vs non-infected control. (d) Fecal C. rodentium CFU counts from infected groups: non-infected control mice were excluded as they did not have any C. rodentium colonies. Results shown are pooled from cohort 1 and 2 (n = 12–16/group until day 14 and 4–6/group until day 22). The analysis of fecal CFU counts was performed with a linear mixed effects model comparing the slopes of the three treatment groups (p = 0.44).
![Figure 7. Effect of IL-4 and Stat6 inhibitor treatment on colitis, serum IgG and fecal CFU in C. rodentium infected WT mice. Mice received IL-4 (0.2 µg/mouse), Stat6 inhibitor (AS1517499, 10 mg/kg body weight [Citation26]) or vehicle (sterile PBS containing 20% DMSO and 1% bovine serum albumin) by intraperitoneal injection for three consecutive days (for cohort 1: from day 11 to day 13, cohort 2: day 10 to day 12 pi). (a) Colitis scores for all treatment groups at 13 and 22 (clearance of infection ≤1000 CFUs/g feces) dpi. The score is the sum of crypt architecture, goblet cell depletion, leukocyte infiltration, presence of lamina propria neutrophils, crypt abscesses, and epithelial damage and ulceration. Results are shown from cohort 2 (n = 5–6/group and time point), and similar results were obtained from cohort 1 (n = 4–5/harvested day 14). (b) Inflammatory cell infiltration at 13 dpi (n = 5–6, cohort 2). (c) Mouse serum IgG response to C. rodentium determined by ELISA at 13 dpi (n = infected vehicle, Stat6 inhibitor and IL-4 treated 5–6, non-infected control 8). Statistics: Kruskall wallis test; *p < 0.05 vs vehicle, &p < 0.05 IL-4, ††p < 0.01 vehicle and ##p < 0.01 Stat6 inhibitor vs non-infected control. (d) Fecal C. rodentium CFU counts from infected groups: non-infected control mice were excluded as they did not have any C. rodentium colonies. Results shown are pooled from cohort 1 and 2 (n = 12–16/group until day 14 and 4–6/group until day 22). The analysis of fecal CFU counts was performed with a linear mixed effects model comparing the slopes of the three treatment groups (p = 0.44).](/cms/asset/e5ad9e0b-bf14-428b-b209-0f19b33725c6/kvir_a_1573050_f0007_b.gif)
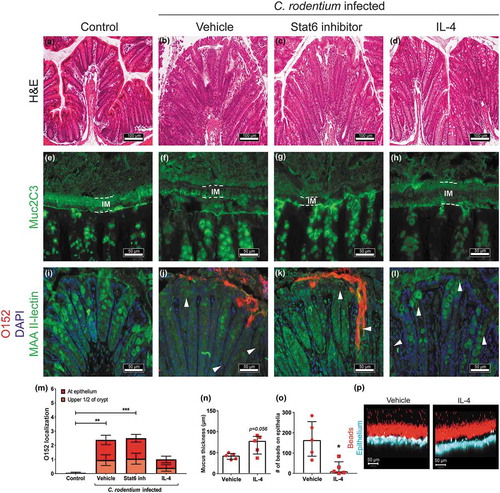
Figure 8. Effect of IL-4 and Stat6 inhibitor treatment on mucus thickness and quality and bacterial localization in WT mice.
Representative images of H&E stained mouse distal colon samples from (a) non-infected non-treated, (b) infected vehicle, (c) infected Stat6 inhibitor and (d) infected IL-4 treated mice. Images were taken with a Nikon Eclipse 90i microscope, using a 20x objective. (e-h) Muc2 (green) immunofluorescence images showing (e) an organized, dense inner mucus layer (IM, highlighted in dotted lines) in non-infected non-treated control mice and (h) infected IL-4 treated mice, whereas F) the IM is poorly defined in infected vehicle and (g) Stat6 inhibitor treated mice at 13 dpi (n = 10, images representative for cohorts 2 and 1). (i-l) Localization of O152 positive bacteria (red) in distal colon (mucus stained with MAA II-lectin, green) in (i) non-infected control and (j) infected mice treated with vehicle, (k) Stat6 inhibitor or (l) IL-4 at 13 dpi (arrowheads point to bacteria). Images were captured using a 40x objective (n = 10, images representative for cohorts 2 and 1). (m) Quantification of bacterial localization in close association with the inner mucus layer/surface epithelial cells and crypts at 13 and 14 dpi (n = 10, results pooled from cohorts 1 and 2). N-P) Ex vivo imaging and analysis of mucus in the distal colon of infected vehicle and IL-4 treated mice using 1 µm beads; inner mucus layer thickness (n), penetrability of 1 µm sized beads (o) and representative images (1 µm sized beads: red, epithelium: blue) using an LSM700 confocal microscope at 20x objective (p) at 13 dpi (n = 5). Please note that mucus thickness in cannot be compared to the data presented here due to that the hydrophobic charcoal used for that measurement floats on top of the mucus, whereas the measurement of the inner mucus layer presented here use beads with ability to penetrate mucus with an altered structure. Statistics: (m) Kruskall wallis test; *p < 0.05, **p < 0.01, ***p < 0.001 vs non-infected control, and (n and o) Mann-Whitney U-test.