
Figures & data
Figure 1. Genetic map of T6SS-related (type 6 secretion system) genes in PCN033. The corresponding components of genes to T6SS are labeled above. The locus tags of T6SS-related genes in PCN033 are marked below. Genes vgrG1 (PCN033_0247) and 0248 (PCN033_0248) are present in the T6SS cluster, and genes vgrG2 (PCN033_1587) and 1588 (PCN033_1588) are located outside the T6SS cluster. Sequencing data for PCN033 can be obtained from the National Centre for Biotechnology Information (NZ-CP006632.1).
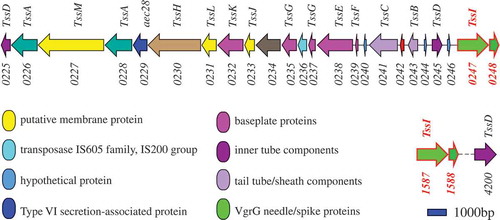
Figure 2. Conserved domain labeling of four putative VgrGs in PCN033. The gp27/gp5 domains of VgrGs of PCN033 were labeled according to the VgrG of CFT073. Proteins are labeled with their respective gene numbers on the left. The gp27/gp5 domain and the residue number are shown above. Different domains are marked in distinct colors. The gp27 domain is colored yellow and the gp5 domain is colored light green and green. The light green part indicates the gp5 OB fold domain and the DUF2345 domain is colored dark green color and purple represents the absence of conserved domain.
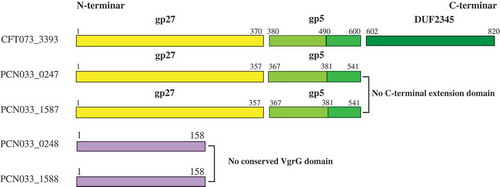
Figure 3. Roles of VgrG family proteins in the virulence and antibacterial activity of PCN033. (a) Survival rate of mice infected with PCN033 or ΔvgrG1Δ0248ΔvgrG2Δ1588. (b) Serum IL-1β levels in mice infected with PCN033 and mutant ΔvgrG1Δ0248ΔvgrG2Δ1588. (c) The antibacterial ability of PCN033, ΔvgrG1Δ0248, ΔvgrG2Δ1588, and ΔvgrG1Δ0248ΔvgrG2Δ1588. Means and SD of three independent experiments in triplicate are calculated. Significant differences between groups are indicated: *(P < 0.05), **(P < 0.01) and ***(P < 0.001).
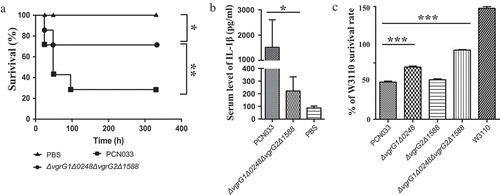
Figure 4. Interaction between bacteria and HBMEC cells. A, B, and C respectively indicate adherence ability, invasion ability, and the cytotoxicity of parental and mutant strains to HBMEC cells. Rates of adherence, invasion and cytotoxicity are expressed relative to those of WT PCN033 (100%). Means and SD of three independent experiments in triplicate are calculated. Significant differences between groups are indicated: *(P < 0.05) and ***(P < 0.001).
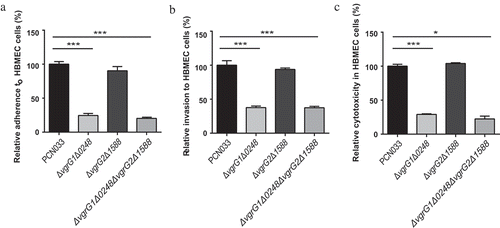
Figure 5. Contribution of VgrG1 in T6SS to the multiplication capacity of PCN033 in mice. (a) Multiplication capacity of parental and mutant strains in different tissues of mice. (b) Multiplication ability of parental, mutants, and complemented strains in different tissues of mice. Significant differences between groups are indicated: *(P < 0.05), **(P < 0.01) and ***(P < 0.001).
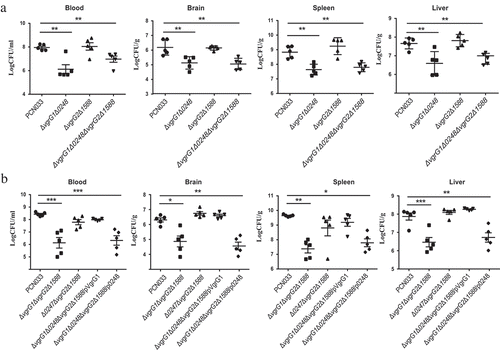
Figure 6. Viability of parental, mutant and corresponding complemented strains in pig whole blood. (a) Survival rate of parental and mutant strains in pig whole blood. (b) Survival rate of parental, mutants and complemented strains in pig whole blood. The survival rates are expressed relative to those of WT PCN033 (100%). Means and SD of three independent experiments in triplicate are calculated. Significant differences between groups are indicated: *(P < 0.05) and ***(P < 0.001).
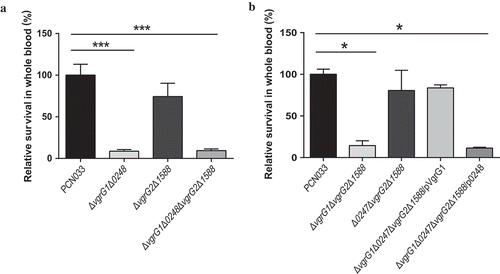
Figure 7. Different functions between VgrG1 and VgrG2 and effect of VgrG1 on activity of T6SS. (a) Antibacterial assay of PCN033, ΔvgrG1Δ0248ΔvgrG2Δ1588, ΔvgrG1Δ0248ΔvgrG2Δ1588/pVgrG1, ΔvgrG1Δ0248ΔvgrG2Δ1588/pVgrG2, and Δhcp1Δhcp2Δhcp3. (b) Survival rate of strains in pig blood. The survival rate is expressed relative to that of WT PCN033 (100%). (c) Rates of adherence and invasion and cytotoxicity of strains to HBMEC cells. Rates of adherence, invasion and cytotoxicity to HBMEC cells are expressed relative to those of WT PCN033 (100%). (d) The transcription level of VgrG1 and VgrG2. Means and SD of three independent experiments in triplicate are calculated. Significant differences between groups are indicated: *(P < 0.05), **(P < 0.01) and ***(P < 0.001).
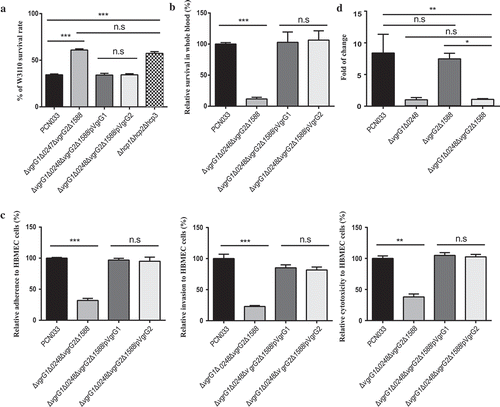
Table 1. Bacterial strains and plasmids used in this study.