Figures & data
Table 1. Description of C. burnetii strains used in this study.
Figure 1. LPS phase profiling of C. burnetii strains used in this study.
The LPS profile of each strain was determined by silver stain (a and b) and immunoblot (c and d). Silver stain banding corresponding to phase I, intermediate, and phase II LPS is indicated to the left of the gel (a and b). Immunoblots were conducted with anti-phase I, anti-intermediate, and anti-phase II LPS antibodies as described in the Materials and Methods [Citation23]. NM Crazy ctrl represents the isogenic passage variant utilized as an LPS control, as previously described [Citation23].
![Figure 1. LPS phase profiling of C. burnetii strains used in this study.The LPS profile of each strain was determined by silver stain (a and b) and immunoblot (c and d). Silver stain banding corresponding to phase I, intermediate, and phase II LPS is indicated to the left of the gel (a and b). Immunoblots were conducted with anti-phase I, anti-intermediate, and anti-phase II LPS antibodies as described in the Materials and Methods [Citation23]. NM Crazy ctrl represents the isogenic passage variant utilized as an LPS control, as previously described [Citation23].](/cms/asset/e9c8cf03-0084-48b7-a47d-67db2c6d4524/kvir_a_1575715_f0001_oc.jpg)
Figure 2. Fever responses of C. burnetii-infected guinea pigs in experiment 1.
Body temperatures were recorded daily from the day of infection (day 0) until the day of euthanasia (day 14). Temperatures were plotted for each individual animal per time point. Fever was defined as ≥ 39.5°C and is indicated by the dotted red line. Data are organized by genomic grouping. Bars represent mean (±SE).
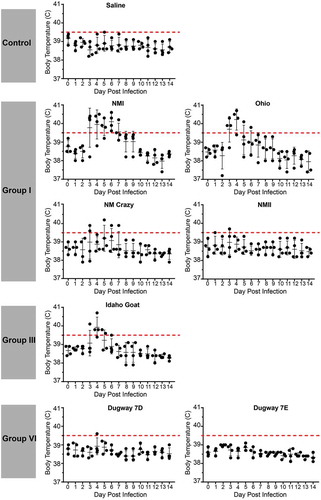
Figure 3. Fever responses of C. burnetii-infected guinea pigs in experiment 2.
Body temperatures were recorded daily from the day of infection (day 0) until the day of euthanasia (day 14). Temperatures were plotted for each individual animal per time point. Fever was defined as ≥ 39.5°C and is indicated by the dotted red line. Data are organized by genomic grouping. Bars represent mean (±SE).
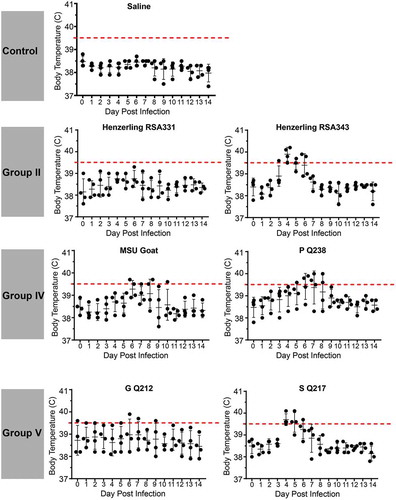
Figure 4. Body weight index (BWI) of C. burnetii-infected guinea pigs in experiment 1.
Body weights were recorded daily from the day of infection (day 0) until the day of euthanasia (day 14). BWI was calculated as described in the Materials and Methods. Each symbol represents the mean value of four animals per group (±SE). Asterisk indicates p < 0.05 compared to the mean value at day 1
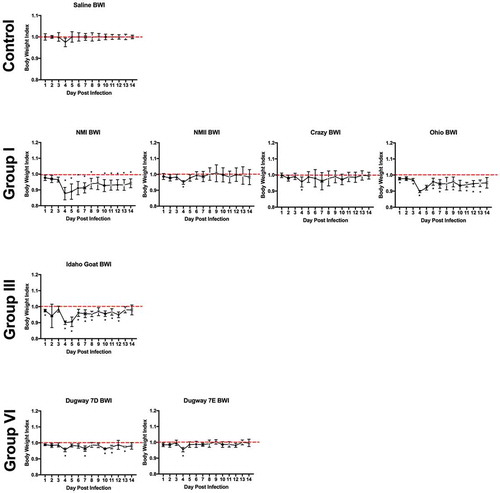
Figure 5. Body weight index (BWI) of C. burnetii-infected guinea pigs in experiment 2.
Body weights were recorded daily from the day of infection (day 0) until the day of euthanasia (day 14). BWI was calculated as described in the Materials and Methods. Each symbol represents the mean value of four animals per group (±SE). Asterisk indicates p < 0.05 compared to the mean value at day 1
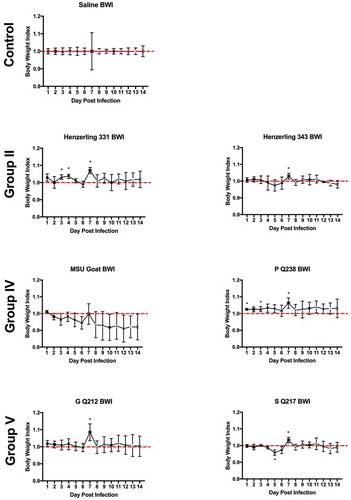
Figure 6. Splenomegaly in C. burnetii-infected guinea pigs.
Spleen weights were obtained at 14 days post infection. Data are presented as a percentage of total guinea pig body weight in an effort to account for baseline variability in organ weight. Asterisk indicates p < 0.05 compared to the mean value of the saline control group.
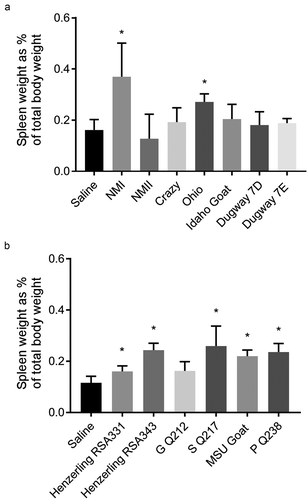
Figure 7. LPS profiles of C. burnetii strains recovered from spleen homogenates.
C. burnetii strains were cultured by adding splenic cellular suspensions to ACCM-D. LPS was extracted from C. burnetii and profiled by silver stain (a and b) and immunoblot (c and d) with anti-phase I, anti-intermediate, and anti-phase II LPS antibodies for one or two representative samples per group. LPS from NMII was included as controls (ctrl).
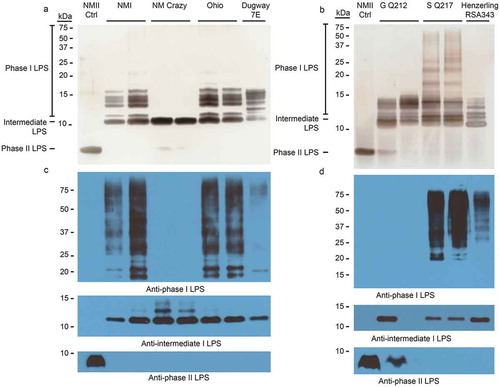
Figure 8. Mesenteric lymph node CD4+ population profile of C. burnetii-infected guinea pigs.
Total mesenteric lymph node cellularity (a) was determined following spleen suspension. The gating strategy utilized for flow cytometric analysis of the CD4+ population in the mesenteric lymph node is shown in (b). CD4+ frequency (c), numbers (d), and median fluorescence intensity (MFI; e) are presented as the mean (±SE) of 4 guinea pigs per group. Asterisk indicates p < 0.05 compared to the mean value of the saline group.
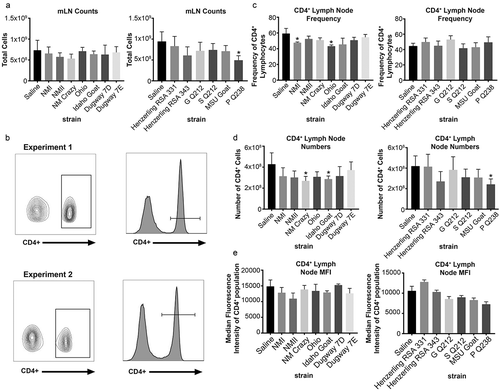
Table 2. C. burnetii-specific IgG serology.
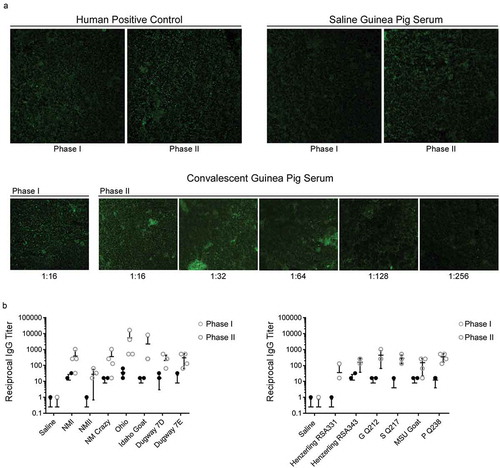
Figure 9. C. burnetii phase I and phase II IgG titers of sera from C. burnetii-infected guinea pigs.
Serum IgG titers of C. burnetii-specific phase I and phase II antigens were determined via IFA. A micrograph of antigen slides treated with human positive control, guinea pig negative control (saline group), and guinea pig positive control (convalescent group, Idaho Goat infected-animal) sera are shown in (a). The reciprocal of the highest dilution that exhibited dim fluorescence (equivalent to that of the positive control at its reference endpoint titer) was defined as the endpoint titer (e.g. 1:256 for the guinea pig positive control shown in a). Strain-specific anti-C. burnetii phase I and II IgG titers are shown in (b). All convalescent guinea pig sera were collected at 14 days post infection.
