Figures & data
Table 1. Details of plasmids used in this study.
Figure 1. Recombinant plasmid pPG-α (containing the gene encoding the toxoid of C. perfringens α-toxin) constructed in this study. The gene fragment encoding the α-toxoid was obtained from plasmid pMD19-T-α constructed in our lab with Sac I and Apa I double-enzyme digestion and was inserted at the corresponding sites of pPG-T7g10, giving rise to pPG-α.
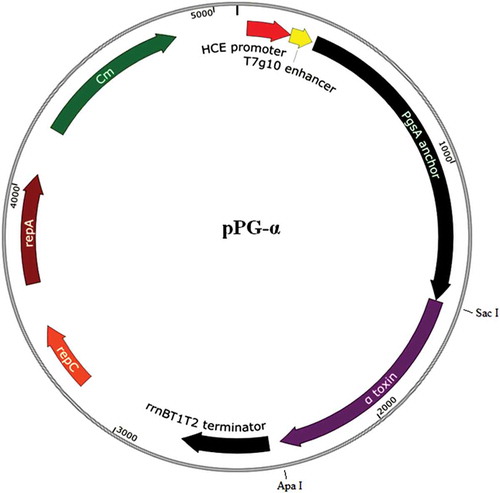
Figure 2. Confirmation of α-toxoid protein expression by pPG-α/L. casei 393. (a) The cell lysates were analyzed by western blotting with an anti–α-toxoid monoclonal antibody, and the results showed that pPG-α/L. casei 393, but not pPG/L. casei 393 and L. casei 393 expressed this toxoid. (b) Determination of the cell surface expression of the α-toxoid by laser confocal microscopy. The results revealed that there was clear-cut green fluorescence on the cell surface of pPG-α/L. casei 393, but not on pPG/L. casei 393. (c) The cell surface expression of the α-toxoid protein as analyzed by flow cytometry.
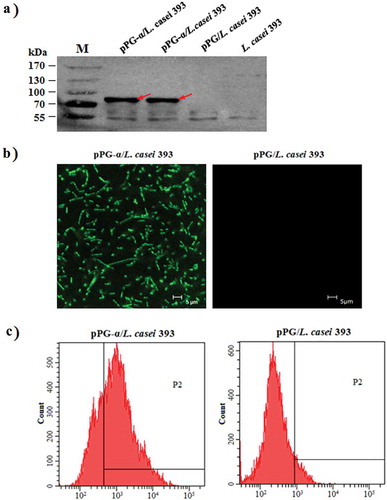
Figure 3. Determination of antigen-specific sIgA and IgG antibody levels in mice immunized with pPG-α/L. casei 393. (a) The immunization scheme, and the schedule of feces, serum, and intestinal mucus sampling. After immunization, immune samples were collected from the mice in each group on days 0, 7, 14, 21, 28, 35, and 42, and anti–α-toxoid sIgA levels in the intestinal mucus (b) and feces (c) and anti–α-toxoid IgG levels in serum (d) were detected by an ELISA. Bars represent the mean ± standard error in each group (*p < 0.05, **p < 0.01 as compared with groups “pPG/L. casei 393” and “PBS”).
Figure 4. Determination of cytokine levels in the serum obtained from pPG-α/L. casei 393–immunized mice. The levels of cytokines IL-2, IL-4, IL-10,IL-12, IL-17, and IFN-γ in serum samples collected on day 35 post-immunization were determined by means of an ELISA kit. Results are mean ± SD (**p < 0.01 as compared with groups pPG/L. casei 393 and PBS).
Figure 5. Neutralizing abilities of antibodies induced in immunized mice against C. perfringens natural α-toxin. C. perfringens natural α-toxin was treated with the serum IgG and mucosal sIgA antibodies obtained from the immunized mice in each group, followed by a challenge to the mice to evaluate the neutralizing abilities of the antibodies. A high survival rate was registered among the mice challenged with the α-toxin treated with IgG (a) or sIgA antibodies (b) induced by pPG-α/L. casei 393, whereas mice challenged with the α-toxin treated with antibodies obtained from mice immunized with pPG/L. casei 393 and PBS all died.
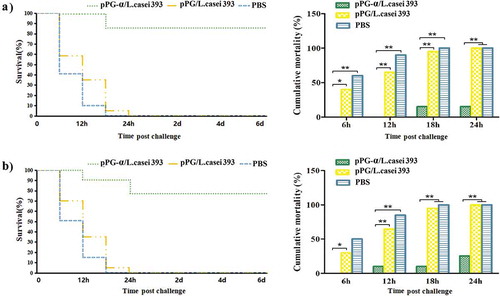
Figure 6. Lymphoproliferation. Splenocytes of the mice in each group were prepared on day 42 after primary immunization and restimulated with the purified α-toxoid protein. Next, lymphoproliferation was detected by the MTT assay. Results were expressed as a stimulation index. Bars represent the mean ± standard error in each group.
Figure 7. Protection efficiency against a C. perfringens natural α-toxin challenge in mice orally immunized with recombinant pPG-α/L. casei 393.
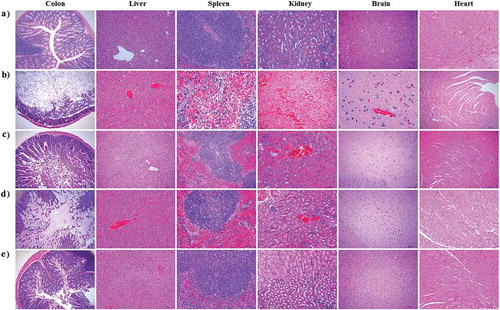
Figure 8. Histopathological examination of immunized mice after a challenge with the α-toxin. No histopathological changes were observed in the heart, liver, spleen, kidneys, colon, and brain of mice in the normal control group (a). Histopathological changes after the challenge were noticed in the tissues of mice orally vaccinated with PBS (b) or pPG/L. casei 393 (c). In the commercial vaccine group (d), histopathological changes were observed in the liver, kidneys, and colon of the mice, particularly in the colon after the challenge, whereas little or no histopathological changes were observed in the tissues of mice orally immunized with pPG-α/L. casei 393 (e). Tissue sections were stained with hematoxylin and eosin and photographed at 40× magnification.